|
San Luis Obispo County Flood Control and Water Conservation District
AGENDA Thursday, July 21, 2022 6:30 P.M. Oceano Community Services District 1655 Front Street, Oceano, California 93445
This is an opportunity for members of the public to address the Committee on items that are not on the Agenda
San Luis Obispo County Flood Control and Water Conservation District
Next Regular Meeting is Tentatively Scheduled for
September 15, 2022 at 6:30 PM at City of Grover Beach Council Chambers Agendas accessible online at www.slocounty.ca.gov/pw/zone3
DRAFT MEETING MINUTES THURSDAY May 19, 2022
A. March 17, 2022 Regular Meeting (Attachment 2 of the Agenda Packet) – Member Reilly motioned to approve, Second by Member Guthrie. Member Gibson requested roll call vote. Motion passed.
Review of the monthly operations reports with the Committee. No public comment was given.
A. 3rd Quarter Budget Status – County Public Works Finance Admin. Services Manager, Jenny Morgan, provided an update on the 3rd Quarter Budget Status (Attachment 5 of the Agenda Packet). The $7.4M budget is broken into three categories: Routine Operations & Maintenance, Non-Routine Operations & Maintenance, and Capital Outlay. At the end of the third quarter, 46% of the total annual budget had been expended.
Routine O&M: This category has a budget of $4.4M. At the end of the third quarter, 67% of the annual budget has been expended, resulting in approximately $1.4M available for the remainder of the year. Expenses in this category are on target with budgeted levels.
Non-Routine O&M: This category has a budget of approximately $1.7M. At the end of the third quarter, 13% of the annual budget has been expended, resulting in an available balance of roughly $1.5M for the remainder of the year. Unspent budget for most of the efforts in this category will be caried forward into next year to allow the continuation to work.
Capital Outlay: This category has a budget of just over $1.32M. At the end of the second quarter, expenses were 16% of the annual budget, resulting in approximately $1M available for the remainder of the year. At the end of the year, unspent budget will be carried forward into next year to continue the projects through completion, however, savings from completed projects may be allocated to other approved projects.
No public comment was given.
Other Agency Involvement/Impact
The agencies involved are: City of Arroyo Grande, City of Grover Beach, City of Pismo Beach, Oceano Community Services District, and County Service Area 12. Subcontractors of CSA 12 include Port San Luis Harbor District and Avila Beach Community Services District.
Financial Consideration
All agencies are current on their payments. The first installment billings for the FY 2022-23 have been mailed out and payments are due July 1, 2022.
Bi-Monthly Update (Attachment 6 of the Agenda Packet) – Updates were provided on the various capital projects (Attachment 6 of the Agenda Packet). Most projects had no changes or updates that could be provided.
Reallocation of District Designated Reserves - $350,000 of Cloud Seeding reserves were rolled into “Public Safety related to water quality and quantity purposes” funds for FY 2022- 23. Motion by Member Barneich, second by Member Bright. Member Gibson requested roll call vote of approval. Motion passed, Reallocation of District Designated Reserves.
Committee requested a summary report of Cloud Seeding efforts completed during Winter of 2021-22. Additionally, the Committee also requested this Cloud Seeding summary report be annually recurring as long as there is participation in the program.
Meeting Adjourned at 7:00 PM Respectfully Submitted, Amber Cordova County of San Luis Obispo Public Works Department
40000
35000
Actual Precipitation Predicted Precipitation Actual Storage 20,000 AF Storage Projection Storage Projection (No Rain) 10,000 AF 14.00
12.00
30000 10.00
25000
7.33 8.00
15000
4.70
5.16
11/28/2022 6.00
10000
3.10
3.12 4.00
2.77
2.14 3.02
2.03 2.91
2.38
2.24 2.98
2.98 3.01 2.76 2.24
5000
0.90
1.34 1.42
1.13 0.94 1.70
0.62
0.98 1.84
0.67
0.98 2.00
0.54 0.24 0.32 0.52 0.410.07 0.32 0.30 0.43 0.36 0.35 0.41
5.44
 0 0
0.060.030.02 0.22 0.03 0.02 0.34 0.070.03 0.02
Date
San Luis Obispo County Flood Control and Water District Zone 3 - Lopez Project - Monthly Operations Report May, 2022


Thursday, June 2, 2022 Data entered by: D. Bravo Report printed by: Admin Page 1 of 1
San Luis Obispo County Flood Control and Water District Zone 3 - Lopez Project - Monthly Operations Report June, 2022


Tuesday, July 12, 2022 Data entered by: D. Bravo Report printed by: Admin Page 1 of 1
San Luis Obispo County Flood Control and Water District Zone 3 - Lopez Project - Monthly Operations Report June, 2022


Monday, July 18, 2022 Data entered by: D. Bravo Report printed by: Admin Page 1 of 1
Annual Cloud Seeding Report Lake Lopez Watershed 2021-2022 Winter Season
Prepared For: County of San Luis Obispo, Department of Public Works
Prepared By: David Yorty Garrett Cammans
North American Weather Consultants, Inc. 8180 S. Highland Dr., Suite B-2 Sandy, Utah 84093
May 2022
TABLE OF CONTENTS
EXECUTIVE SUMMARYFor the 2021-2022 winter season, cloud seeding operations were conducted to enhance precipitation in the Lopez Lake drainage in San Luis Obispo County. A ground-based seeding location (Arroyo Grande) was utilized for specifically for this area. Seeding was also conducted from other sites when conditions were favorable, including Mt. Lospe and Berros Peak. The formal operational period began December 1, 2021 and ended April 15, 2022. An extension of the program was offered by NAWC in order to seed a storm that was forecasted to impact the watershed on April 21st. This extension was offered at no additional fixed cost, NAWC only requested the reimbursement of flares used for this storm.
The cloud seeding equipment used in this program is of a proprietary design and uses high output cloud seeding flares. The equipment is designed to be operated remotely via cellular link. This equipment was designed specifically for cloud seeding operations on the California coastline, where storms are characterized by high values of super cooled liquid water. Operations for the project were directed by David Yorty, a NAWC meteorologists, who is a certified weather modification manager by the Weather Modification Association (WMA). Coordination of all seeding activities was maintained with Mr. David Spiegel with the County of San Luis Obispo Department of Public Works.
As with the prior season. The ENSO (El Niño-Southern Oscillation) phase was classified as a La Nina again during the 2021-2022 winter season. Precipitation in San Luis Obispo County and around the rest of the Central Coast was again well below normal for the season. Rainfall from the beginning of the water year (September 1, 2021) through April 2022 is summarized in Table E-1.
Table E-1 2021-2022 Monthly Precipitation (Inches) For Locations near the Lopez Lake Target Area
Climate OverviewAs reported last year, every ten years, the National Oceanic and Atmospheric Association (NOAA) releases a summary of various U.S. weather conditions for the past three decades to determines average values for a variety of conditions, including, temperature and precipitation. This is known as the U.S Climate normal, with a 30-year average, representing the “new normal” for our climate. These 30-year normal values can help to determine a departure from historic norms and identify current weather trends. The recently released 30-year average ranges from 1990 – 2020. Images in Figures E1 and E2 show how each 30-year average for the past 120 years compares to the composite 20th century average for temperature and precipitation. For the western U.S., the 1990-2020 average show much warmer than average temperatures, in comparison to the 100-year 20th century average. When comparing precipitation for the past 30 years to both the previous 30-year average and the 1901-2000 average, the American Southwest (including portions of Utah, Arizona, California and Nevada) has seen as much as a 10% decrease in average annual precipitation.
Figure E1 U.S. Annual Temperature compared to 20th-Century Average Figure E2 U.S. Annual Precipitation compared to 20th-Century Average
The 2022 water year was no exception to the general drying trend experienced over the past 30 years. Severe drought conditions engulfed the southwestern region of the United States. Reservoir storage for the California Region was only 50% of average at the end of April. Similar reservoir shortages are currently impacting Nevada, Utah, Arizona, New Mexico, Oklahoma and Texas after the uncharacteristically dry winter season. Figure E-3 shows reservoir conditions by US region, as recorded by the USDA.
Figure E3 Regional reservoir storage as of April 30th 2022
Cloud Seeding OverviewSeeding opportunities occurred on 7 days during the 2021-2022 operational season. Five of these were in December, with one additional seeded event in March. A total of 41 flares were successfully burned to target the Lopez Lake watershed, releasing an estimated 656 grams of AgI. Unfortunately, no seeding opportunities occurred during January or February. There were no seeding suspensions during the season.
Based on NAWC’s evaluations of nearby programs with longer history in San Luis Obispo and Santa Barbara Counties, ground-based seeding is significantly more efficient than aerial seeding. It is NAWC’s recommendation that the Agency continue the ground-only operational cloud seeding project with the current NAWC design. This design can and should be modified as needed for specific winter seasons and to account for any changes to climatic conditions, or special circumstances such as burn areas.
1.INTRODUCTION
1.1Program HistoryNorth American Weather Consultants (NAWC) conducted its first season of cloud seeding operations during the 2019-2020 winter season with the County of San Luis Obispo Department of Public Works. The Agency issued a Request for Proposals (RFP) on September 16, 2019 for a cloud seeding program of up to three seasons duration. NAWC was awarded this contract on December 17, 2019. NAWC, with headquarters in Sandy, Utah, conducted a 4.5-month cloud seeding program for the Agency from this current season from December 1, 2021 through April 15, 2022. Although NAWC’s original proposal included both airborne and ground-based seeding, the ground-based portion of the program has been utilized more frequently than aircraft due to budgetary constraints.
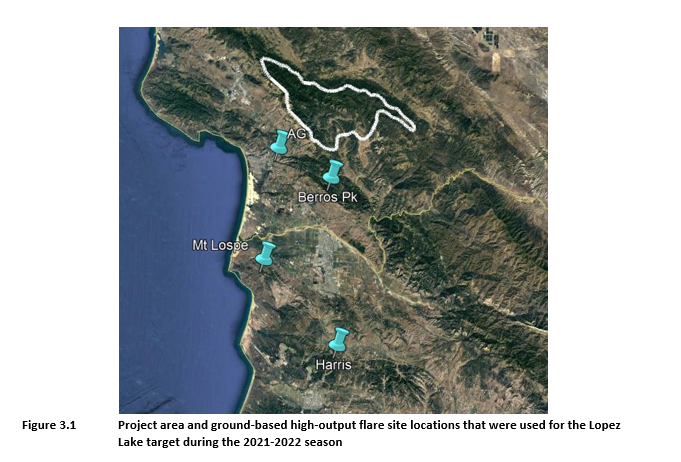
For the 2021-22 season, seeding was conducted from four ground-based sites. This includes Arroyo Grande, Berros Peak, Mt. Lospe, and Harris Grade (shown on the map in Section 3.0). All of the seeding sites contained Automated High Output Ground Seeding (AHOGS) systems. These systems use flares with high concentrations of silver iodide, dispersed through remote means (cellular data connection) to introduce seeding agents into storms systems. All seeding decisions were made by a Weather Modification Association (WMA) certified project meteorologist with a Master’s degree in meteorology.
1.2Seasonal Weather SummaryThe ENSO (El Niño-Southern Oscillation) phase was classified as a La Nina once again during the 2021-2022 winter season. Precipitation in and around the Central Coast in general was well below normal this season. Rainfall from the beginning of the water year (September 1, 2021) through April 30 ranged from roughly 50-80% of the average total weather year values. Table 1-1 shows precipitation amounts from several stations in San Luis Obispo County.
Table E-1 2021-2022 Monthly Precipitation (Inches) For Locations near the Lopez Lake Target Area
Figure 1.1 is a drought monitor comparison for April 13, 2021 and April 5, 2022. These two maps are similar in that nearly all of the state has at least severe drought (D2) and approximately a third to half of the state has extreme drought (D3). In general, extreme drought conditions have expanded to include more coastal areas and have become slightly less extreme in the southern Sierra and desert areas east of there, since spring of 2021.
Figure 1.1 U.S. Drought Monitor Conditions for California for April 13, 2021 (left) and April 5, 2022 (right)
1.3Report Terms and Acronyms
Table 1-2 Project Acronyms and Descriptions
2.CLOUD SEEDING RESEARCH AND MECHANISMS
Two scientific mechanisms have been described concerning the potential to augment precipitation with cloud seeding. One of these involves increasing an individual cloud's efficiency in producing precipitation, while another potential (resultant) effect of this is the enhancement of cloud development in the individual cloud or within the larger system, leading to additional precipitation. The first mechanism has often been referred to as the static seeding hypothesis, while the second relies upon dynamic effects of cloud growth. In many situations, both processes could be operative, whereby a cloud's precipitation efficiency is increased, and the cloud is made to grow larger due to seeding. Clouds contain water vapor, water droplets and frequently ice crystals if cloud temperatures drop below freezing. Discoveries in the late 1940's established that microscopic particle of silver iodide, cause super cooled water droplets to freeze (Vonnegut, 1947). Moisture in a cloud deck will remain aloft unless it congregates and forms snowflakes that are heavy enough to overcome the storms natural updrafts. Pure water, can remain liquid and therefore suspended in a cloud deck until temperatures as cold as -17o C. Silver iodide can speed up this process of freezing, congregating, forming a snowflake and falling as precipitation, by acting as a catalyst for the freezing of liquid water well above -17o C. Through this process, silver iodide can therefore enhance a storms natural productivity by making the snow flake formation process more efficient. These supercooled water droplets are the normal targets of most present-day cloud seeding programs. More on this in future sections.
2.1Precipitation ProcessesThere are two basic mechanisms that produce precipitation: collision-coalescence and ice formation. The collision-coalescence process is defined as the growth of raindrops by the merging and/or colliding of cloud drops and small precipitation particles. This process is especially important for the rainfall process in tropical climates, but it can also be a factor in the formation of rainfall in more temperate climates like those found in Santa Barbara County. Ice formation or nucleation, as described in the Bergeron-Findeisen theory, consists of a process in which precipitation particles may form within a mixed cloud, which is one composed of both ice crystals and liquid water drops. In such clouds the ice crystals can gain mass by deposition (water vapor turning directly to ice) at the expense of the liquid drops surrounding the ice crystals, by accumulation of these water drops (riming). Upon attaining sufficient weight, the ice crystal would typically fall to the ground as snow if the surface temperatures are at or below freezing, or melt and fall as raindrops if the surface temperatures are warmer than freezing. This Bergeron- Findeisen process is important in the production of snow and rain in the more temperate climates like those found in Santa Barbara County. The presence of supercooled water droplets in clouds is usually the focus of cloud seeding efforts.
2.2Ice NucleationAs discussed in the previous section, clouds often contain liquid cloud droplets at sub-freezing temperatures. These droplets are termed supercooled. The natural tendency is for these droplets to freeze, but to do so at temperatures warmer than -39°C they need to encounter an impurity. There are a variety of particles present in the atmosphere that possess the ability to cause these supercooled droplets to freeze. In this context, these particles are known as freezing nuclei or ice nuclei. Research has demonstrated that certain types of natural particles (for example, dust or salt particles, and even a certain type of bacteria) in the atmosphere often serve as freezing nuclei. The conversion of a supercooled water droplet into an ice crystal is referred to as nucleation. It is known that the nucleating efficiency of these naturally occurring freezing nuclei increases with decreasing temperatures. It has also been established that naturally occurring freezing nuclei active in the temperature range of approximately -5 to -15°C are relatively rare. Research has also shown that minute (microscopic) particles of silver iodide begin to act effectively as freezing nuclei at temperatures colder than -5°C (Dennis, 1980). Some more recently developed seeding formulations show nucleation at temperatures as warm as -4°C. Silver iodide is the agent most commonly used to seed clouds when relying on the ice nucleation process. There are two types of ice nucleation: condensation-freezing and contact. In condensation freezing, a nucleus first serves as a condensation nucleus in forming a cloud droplet. At temperatures of approximately -5°C or colder these same nuclei can serve as freezing nuclei. In other words, under the right conditions, a nucleus can a) aid condensation, forming a cloud droplet and b) then promote freezing on the same nucleus, forming an ice crystal. Contact nucleation, as the name implies, means that a freezing nucleus must come in physical contact with a supercooled cloud droplet, thus causing it to freeze if the temperature of the cloud droplet is cold enough for the freezing nuclei to be active. Contact nucleation can be a relatively slow process compared to condensation-freezing nucleation, which can be quite rapid, on the order of one to a few minutes.
2.3Impacts of Silver Iodide SeedingSince a scarcity of natural ice nuclei commonly exists in the atmosphere at temperatures in the range of -5 to -15°C, many clouds may be inefficient in converting water droplets into ice crystals. The addition of silver iodide nuclei to these cloud regions can produce additional ice crystals, which, under the right conditions, grow into snowflakes and fall out of the cloud as either snow or rain. Rain is produced by the melting of such snowflakes when they fall through warmer air near the ground. This increase in efficiency is usually referred to as a static seeding effect.
In the process of converting supercooled cloud droplets into ice crystals, additional heat is added to the cloud due to the release of the latent heat of fusion. This additional heat may increase the buoyancy of air within the clouds, resulting in a dynamic effect. This postulated dynamic effect was the basis for a National Oceanic and Atmospheric Association (NOAA) research program conducted in Florida known as the Florida Area Cumulus Experiment (FACE). Two different phases of FACE 1, 1970-76 and FACE 2, 1978-80 (Woodley et al., 1983) indicated increases in area-wide rainfall, but results fell short of strict statistical acceptance criteria. Rainfall increases from seeded convection bands in the Santa Barbara II research program (Brown et al., 1974) were attributed to both static and dynamic effects. NAWC conducted this research program in Santa Barbara County with funding from the Naval Weapons Center at China Lake.
2.4Santa Barbara II Research ProgramThere was an early research program conducted in Santa Barbara County, termed Santa Barbara I, which was conducted from 1957-1960 and was sponsored by various organizations including the State of California, The University of California, Santa Barbara and Ventura counties, the National Science Foundation, the U.S. Weather Bureau, and the U.S. Forest Service. This program employed randomized seeding during storm periods using ground-based silver iodide nuclei generators. Results from this research program suggested precipitation increases of 45% in some areas but were not statistically significant. Further information about this program can be found in Appendix A of this report. A second research program conducted in the county was known as the Santa Barbara II program, which was conducted during the winter seasons of 1967 to 1973. Santa Barbara II was conducted in two primary phases. Phase I consisted of the release of silver iodide from a ground site located near 2,600 feet MSL in the Santa Ynez Mountains northwest of Santa Barbara. These silver iodide releases were made as convection bands passed overhead. The releases were conducted on a random seed or no-seed decision basis in order to obtain baseline non-seeded, natural, rainfall information for comparison. A large network of recording precipitation gauges was installed for the research program (Figure 2.1). The amount of precipitation that fell from each seeded or non- seeded convection band was determined at each precipitation gauge location. Average convection band precipitation for seeded and non-seeded events was calculated for each rain gauge location. Figure 2.2 shows the results of seeding from the ground as contours of the ratios of average seeded band precipitation to the non-seeded band precipitation. Ratios greater than 1.0 are common in Figure 2.2. A ratio of 1.50 would indicate a 50 percent increase in precipitation from seeded convection bands. The increase was shown to be statistically significant in this study, unlike in Santa Barbara I. The reasoning for the difference in statistical significance between these studies can be found in Appendix B. The high ratios in southwestern Kern County are not significant in terms of amounts of additional rainfall since the
convection bands (both seeded and non-seeded) rapidly lose intensity as they enter the San Joaquin Valley. In other words, a high percentage applied to a low base amount does not yield much additional precipitation. These apparent effects may be due to delayed ice nucleation (compared to other seeding methods), which would be expected with the type of seeding flares used in this experiment which operated by contact nucleation, a relatively slow process. The low amounts of natural precipitation in southwest Kern County results from evaporation in downslope flow in the winter storms that affect this area. Such predominant downslope flow areas are frequently known as rain-shadow areas in the lee of mountain ranges. Figure 2.3 dramatically exhibits this feature from the coastal mountains in Central and Southern California, which are wet, to the San Joaquin and Imperial Valleys, which are relatively dry. The 1.5 ratios along the backbone of the Santa Ynez Mountains are, however, significant in terms of rainfall amounts since this area receives higher natural precipitation during winter storms due to upslope flow. This upslope flow is also known as an orographic effect and accounts for many mountainous areas in the west receiving more precipitation than adjoining valleys, especially downwind valleys. It was concluded that convection band precipitation was increased over a large area using this ground-based seeding approach. In a similar experiment, phase II employed an aircraft to release silver iodide (generated by silver iodide - acetone wing tip generators) into the convection bands as they approached the Santa Barbara County coastline west of Vandenberg Air Force Base. The convection bands to be seeded were also randomly selected. Figure 2.4 provides the results. Again, a large area of higher precipitation amounts is indicated in seeded convection bands compared to non-seeded convection bands. Notice the westward shift of the effect in this experiment versus the ground- based experiment. This result is physically plausible since the aircraft seeding was normally conducted off the coastline in the vicinity of Vandenberg Air Force Base (for example, west of the ground-based release point), which is further upwind. Material released from the ground also takes some amount of time to reach the -5° C level in cloud, depending on vertical mixing of the atmosphere. A study of the contribution of convection band precipitation to the total winter precipitation in Santa Barbara County and surrounding areas was conducted in the analysis of the Santa Barbara II research program. This study indicated that convection bands contributed approximately one- half of the total winter precipitation in this area (Figure 2.5). If it is also assumed that all convection bands could be seeded in a given rainy season and that a 50 percent increase was produced, the result would be a 25 percent increase in total rainy season precipitation when these assumptions are correct (although this could be a somewhat optimized situation). Two NAWC reports (Thompson et al., 1988 and Solak et al., 1996) provided a more precise
quantification of the optimal seasonal seeding increases that might be expected at Juncal and Gibraltar Dams of 18-22%, respectively, from seeding convection bands.
Figure 2.1 Santa Barbara II project map with rain gauge locations, radar and seeding sites.
Figure 2.2 Seeded/Not-Seeded Ratios of band precipitation for Phase I.
Figure 2.3 Annual average precipitation (inches), Southern California 1980-2010.
Figure 2.4 Seeded/Not-Seeded ratios of band precipitation for Phase II aerial operations, 1970-74 seasons.
Figure 2.5 Approximate percentage of winter precipitation occurring in convection bands, 1970-74 seasons.
For illustration purposes, Figure 2.6 provides a sequence of six radar images of a convection band as it moved into Santa Barbara County on April 11, 2010. The radar images are from the Vandenberg AFB radar site. Table 2-1 provides 30-minute interval rainfall values observed at Orcutt during the passage of this convection band. The highest 15-minute rainfall total (not shown in the table) was 0.35 inches between 1725 and 1740 PDT during the passage of the heaviest portion of the band, corresponding to the time period between the 2nd and 3rd images in the sequence. Short- duration rainfall rates peaked at close to 2 inch per hour for a brief period around 1730 PDT. Rainfall rates then averaged around a quarter inch per hour or less during the remainder of the event (after about 1800 PDT).
Table 2-1 Short Duration Rainfall Amounts at Orcutt During Storm Event in Figure 2.6
In summary, earlier research conducted in Santa Barbara County indicated that convective bands are a common feature of winter storms that impact Santa Barbara County and that those bands contribute a significant proportion of the rainy season precipitation. In addition, research has indicated that these bands contain supercooled liquid cloud droplets, the target of most modern- day cloud seeding activities (Elliott, 1962). Seeding these bands with silver iodide either from the ground or air increases the amount of precipitation received at the ground. These bands are typically oriented in a general north to south fashion (for example, northeast to southwest, northwest to southeast) as they move from west to east. It is common to have at least one convective band per winter storm with as many as three or four per storm on occasion. One band is usually associated with a primary cold frontal passage through the county. Frequently, these frontal bands are the strongest, longest-lasting bands during the passage of a storm. Other bands may occur in either pre-frontal or post-frontal situations. The duration of these bands over a fixed location on the ground can vary from less than one hour to several hours.
Table 2-1 Short Duration Rainfall Amounts at Orcutt During Storm Event in Figure 2.6
In summary, earlier research conducted in Santa Barbara County indicated that convective bands are a common feature of winter storms that impact this region and that those bands contribute a significant proportion of the rainy season precipitation. In addition, research has indicated that these bands contain supercooled liquid cloud droplets, the target of most modern day cloud seeding activities (Elliott, 1962). Seeding these bands with silver iodide either from the ground or air increases the amount of precipitation received at the ground. These bands are typically oriented in a general north to south fashion (for example, northeast to southwest, northwest to southeast) as they move from west to east. It is common to have at least one convective band per winter storm with as many as three or four per storm on occasion. One band is usually associated with a primary cold frontal passage through the county. Frequently, these frontal bands are the strongest, longest-lasting bands during the passage of a storm. Other bands may occur in either pre-frontal or post-frontal situations. The duration of these bands over a fixed location on the ground can vary from less than one hour to several hours.
3.PROGRAM DESIGN
The winter cloud seeding program is conducted for the Lopez Lake watershed in San Luis Obispo County. The target area and available seeding sites are depicted in Figure 3.1. The objective of the program was to seed all suitable storm systems affecting the target area that contained organized convective bands, unless precluded by previously established suspension criteria as discussed in Section 5.0.
Figure 3.1 Project area and ground-based high-output flare site locations that were used for the Lopez Lake target during the 2021-2022 season
Some generalized seeding criteria that NAWC uses to help determine whether an approaching storm contains suitable conditions for seeding.
It has always been NAWC’s philosophy that the design of our operational programs should be based upon prior research programs that provided positive indications of increases in precipitation, to the extent that the research results are considered to be representative of the
operational programs’ conditions (this assumes research results from one location are transferable to the operational program’s target area).
As a result of the research described in section 2 of this report, NAWC believes the best program design for a winter cloud seeding program in Santa Barbara County and southern San Luis Obispo County to be one that relies primarily on an effective ground strategy, paired to, when funding allows, a comprehensive areal program. The development of AHOGS for this, and other California programs, came in an effort to maximize the effectiveness of ground-based seeding for program areas where high yield and highly convective coastal storms are present. The AHOGS allow NAWC to use the same high concentration dispersion flares (previously only used on the wings of planes), from the ground. This combines the financial efficiency of ground-based operations, with the operational effectiveness of high output seeding methods.
4.EQUIPMENT, PROCEDURES AND PERSONNEL
Each operational cloud seeding program relies upon a mix of suitable equipment, customized procedures and qualified personnel. These elements were described in a comprehensive Operations Plan for the Santa Barbara program for the 2021-2022 winter season. Various components of this plan are discussed below.
4.1Weather RadarThe Vandenberg AFB radar site has been utilized for the operation of the cloud seeding program since 2001. It provides information on precipitation location and intensity, as well as wind speed and direction within the precipitation echoes and a large array of additional products. The radar step-scans through 14 different elevation angles in a 6-minute period. The maximum range for the detection of precipitation echoes is 143 miles from the radar. These radar systems are operated and maintained by the National Weather Service (NWS). The NWS radar sites have dual polarization capability in recent years, which provides the ability for the radar to differentiate between various hydrometeor (precipitation) types and identify non-weather phenomenon such as insects, dust, and ground clutter.
4.2AHOGS Ground-Based Seeding SystemsThe Automated High Output Ground Seeding Systems (AHOGS) allow automated, focused, high- output seeding releases from strategic ridgeline locations under program control from the project operations center with the proper computer software and password. These systems give the project meteorologist the ability to conduct intensive seeding of convection rain bands as they track into and across the project area under different wind flow regimes.
Each AHOGS site is controlled via a modem and can be connected via the internet where the LoggerNet software is installed. This software allows the user to manage the flare seeding operations and allows monitoring and reporting of AHOGS site status information, such as flare inventory and battery voltage. The project meteorologist has the option of firing flares individually in real time, or to order batch firing of any number of flares at selectable intervals at each site, e.g., three flares at 15-minute intervals, beginning at any selected time. NAWC utilized a total of three custom AHOGS sites for the 2021-2022 winter season to affect the Lopez Lake target area. NAWC believes higher elevation seeding sites to be somewhat more effective since the base of the convective bands may not reach lower elevations during their passage over the target area. Such conditions could result in the lack of transport of the seeding agent into effective regions within the bands. Location is important since the effects of seeding will occur downwind (generally east through north of the site location). The existing sites were selected as ones that would offer potential targeting of seeding effects under the most common lower-level wind flow regimes experienced with the passage of convective bands the area. Table 4-1 provides location and elevation information for the AHOGS sites.
Table 4-1 AHOGS Site Locations
These systems were designed for intensive seeding of convection bands using high-output pyrotechnic flares. Each AHOGS consists of the following primary onsite components:
The pyrotechnic flares used at the AHOGS sites produce high-output, fast-acting silver iodide complexes during a burn time of approximately 3-4 minutes. Even though the cloud seeding program is conducted during the winter season, there can still be periods when the ground cover
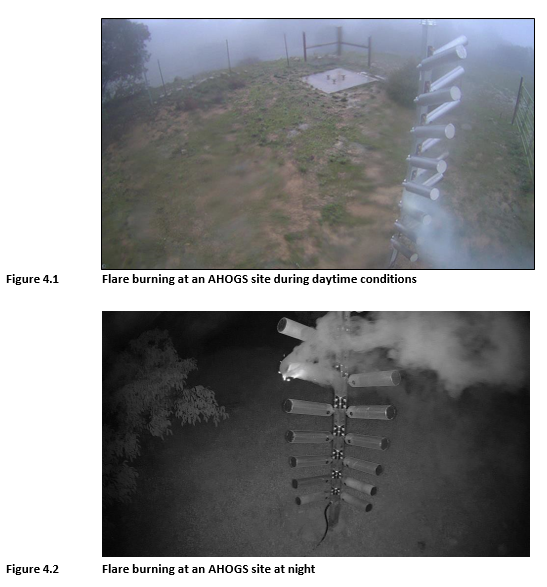
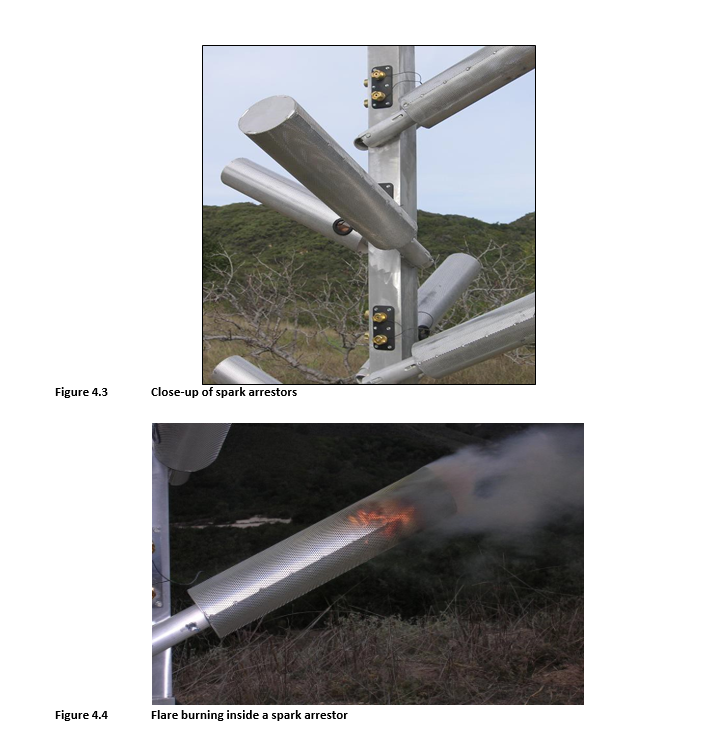
may be dry. Weed abatement and ground care is performed prior to the onset of each season, and periodically throughout the season as needed. Spark arrestors are placed over the flares to keep embers from reaching the ground. Figures 4.1 and 4.2 provide photos from one of the video cameras that show seeding flares burning in both day and night conditions. Figure 4.3 shows a close up of the spark arrestors and Figure 4.4 shows a flare burning inside a spark arrestor.
Figure 4.1 Flare burning at an AHOGS site during daytime conditions
Figure 4.2 Flare burning at an AHOGS site at night
Figure 4.3 Close-up of spark arrestors
Figure 4.4 Flare burning inside a spark arrestor
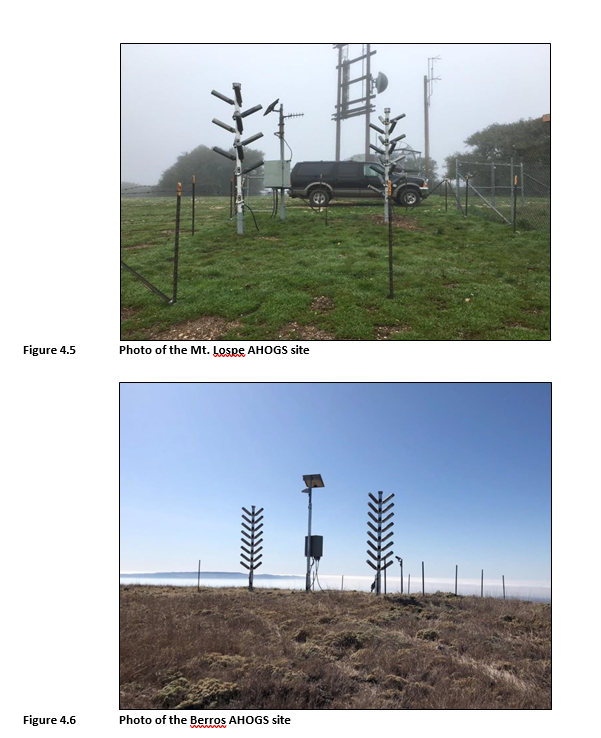
The site video cameras are very useful during seeding operations since they allow the project meteorologist to verify the firing of flares. If a malfunction were to occur, the project meteorologist could substitute another flare. Some site photos can be seen in Figures 4.5 – 4.6.
Figure 4.5 Photo of the Mt. Lospe AHOGS site
Figure 4.6 Photo of the Berros AHOGS site
4.3Operations CenterNAWC’s corporate headquarters in Sandy, Utah served as the operations center for the program. The project meteorologist’s computers have the LoggerNet software necessary to activate the AHOGS sites. A variety of meteorological data are used to assist in decision-making, as described in the following section.
4.4Weather Forecasts and Meteorological Data AcquisitionNAWC project meteorologists were responsible for the determination of when seedable conditions were present and whether seeding suspension criteria were met. Coordination between NAWC’s project meteorologist and Mr. David Spiegel, of the San Luis Obispo County Department of Public Works, was involved in the decision-making process. NAWC’s project meteorologists were also responsible for archiving relevant weather data (for example, local NEXRAD radar displays, satellite photos and rainfall data) from each event. Examples are shown in Section 5.0, which discusses last season’s operations. A variety of weather information is available online that was used to forecast approaching storms, observe weather conditions during storms as they passed through Santa Barbara County and document conditions of interest (to seeding decisions) or of concern, for example those related to suspension criteria. Some of these useful products include:
4.5Seeding ProceduresNAWC’s conceptual model of the dynamics of the convection bands is that they are similar to convective bands that can occur in other parts of California during winter storms and other parts of the U.S. when a frontal structure is involved. The primary low to mid-level inflow to these bands is usually along the leading edge of the bands. These inflow regions are the areas containing stronger updrafts, and are also the development and accumulation zones of supercooled liquid cloud droplets. Consequently, this is the desired region for the introduction of the seeding material. This would mean that flares burned at the ground sites would be timed to occur as the leading edge of the bands, as determined by the Vandenberg AFB NEXRAD radar, approached the ground sites. Low-level winds from the surface up to roughly the -5° C level are considered for targeting of seeding effects, as well as the avoidance of seeding over areas that meet any suspension criteria. The HYSPLIT model, discussed in Section 6.0, was also used in real time to help forecast seeding material dispersion from available sites.
4.6Suspension CriteriaSuspension criteria were developed jointly between the County and NAWC personnel to serve as safeguards to avoid seeding during situations of extreme weather or adverse hydrologic conditions. Previously, special criteria had been developed and implemented following large fire events within the target areas. Since 1989, different types of suspension criteria for this project have been adopted and amended annually as needed. Cloud seeding suspension criteria were invoked whenever the National Weather Service (NWS) issued a severe storm, or flood warning that affected any part of the project area. Appendix B contains the suspension criteria for the 2021-2022 seeding program. Seeding suspension criteria were monitored during some of the heavier precipitation periods, although some of the heavier precipitation event periods did not coincide with seeding operations since they did not meet NAWC’s generalized seeding criteria (Table 3-1). There were no seeding suspensions during the season.
4.7PersonnelThe following agencies and personnel were responsible for the conduct of the 2021-2022 cloud seeding program. San Luis Obispo County Department of Public Works Mr. David Spiegel, P.E.
North American Weather ConsultantsMr. Garrett Cammans, President Mr. David Yorty, primary Project Meteorologist Mr. Cole Osborne, back-up Program Meteorologist Mr. Tom Segura, Local Equipment Technician
5.OPERATIONS
All operations were conducted in accordance with established suspension criteria, which were developed for a variety of situations, such as high intensity rainfall, flood warnings and streamflow discharge. Suspension criteria can be found in Appendix B. The 2021-2022 winter season was characterized by a La Niña phase of the El Niño Southern Oscillation (ENSO). Table 5-1 shows the evolution of the ENSO 3.4 region index throughout the season. A value of -0.5 or less indicates La Niña conditions present and a value of +0.5 or more indicates that El Niño conditions are present. Values between -0.5 and +0.5 are considered neutral. The observed values this season were indicative of the La Niña ENSO phase, as shown in the table, and were essentially identical to the indices of the 2020-2021 season.
Table 5-1 December 2021 – April 2022 ENSO Values
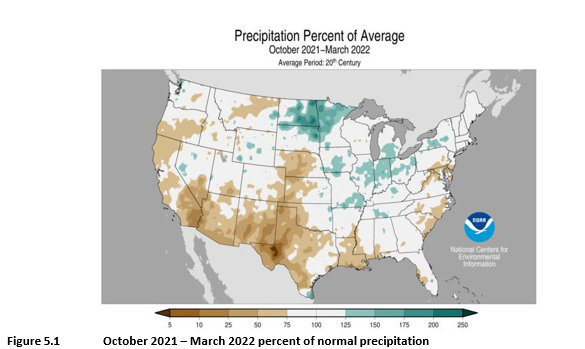
5.1Summary of the 2021-2022 Winter Season RainfallSan Luis Obispo County rainfall for the 2021-2022 season was again below normal, averaging about two-thirds of the total water year average as of April 30. Above normal precipitation occurred in December, with most other months being below normal. January and February brought very little precipitation, generally under a quarter inch to the target areas. Precipitation in much of the southwestern U.S. was below average during the October 2021 – March 2022 period, as shown in Figure 5.1.
Figure 5.1 October 2021 – March 2022 percent of normal precipitation
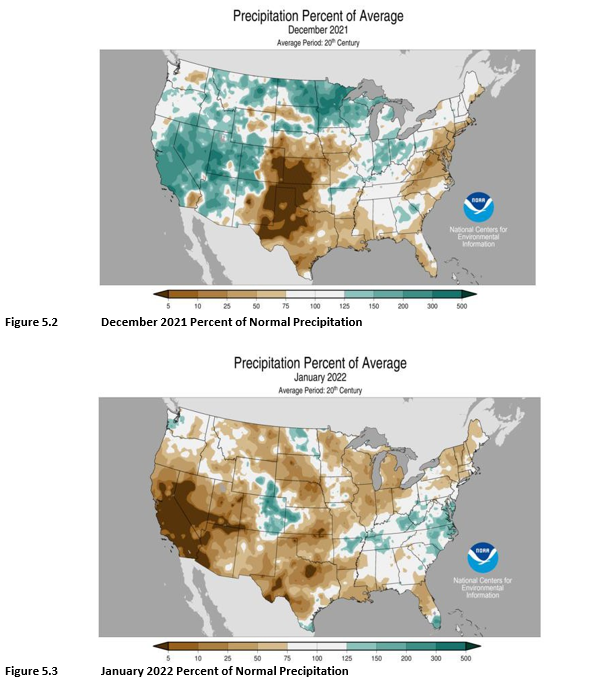
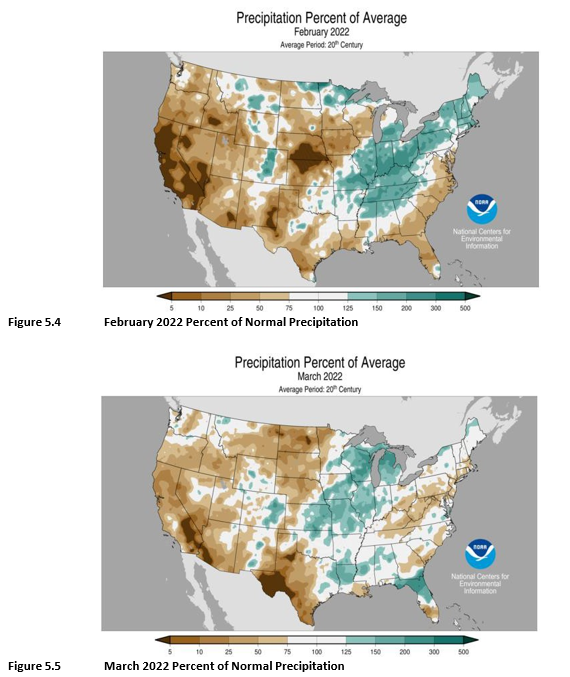
December brought well above normal rainfall to the County, with totals generally over twice the December average. There were five seeded storm events, which was by far the majority of the operations that occurred this season. January precipitation was well under 10% of the monthly average, and there no seeded events.
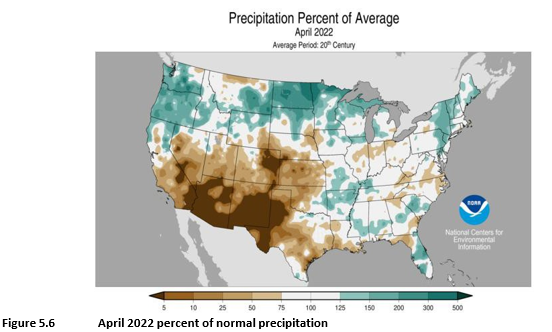
February was the driest month of the season with precipitation of only about 1 to 4% of the monthly average, and no seeding opportunity. March precipitation was somewhat more reasonable but still very low, ranging from about 30- 50% of the monthly normal. The vast majority of this occurred in a significant (and seeded) storm event on March 28, the only seeding opportunity of the month. April provided one more seeding opportunity, with a special extension to seed an April 21 storm event at no additional cost except for the seeding flares used. Figures 5.2 - 5.6 show a month by month glace at percent normal monthly precipitation patterns this season for the United States.
Figure 5.2 December 2021 Percent of Normal Precipitation
Figure 5.3 January 2022 Percent of Normal Precipitation
Figure 5.4 February 2022 Percent of Normal Precipitation
Figure 5.5 March 2022 Percent of Normal Precipitation
Figure 5.6 April 2022 percent of normal precipitation
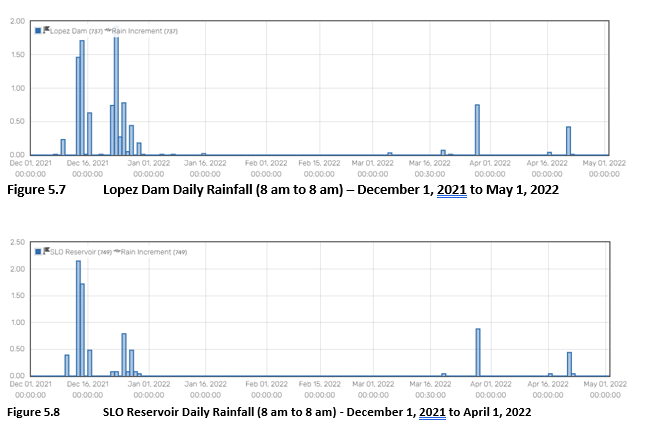
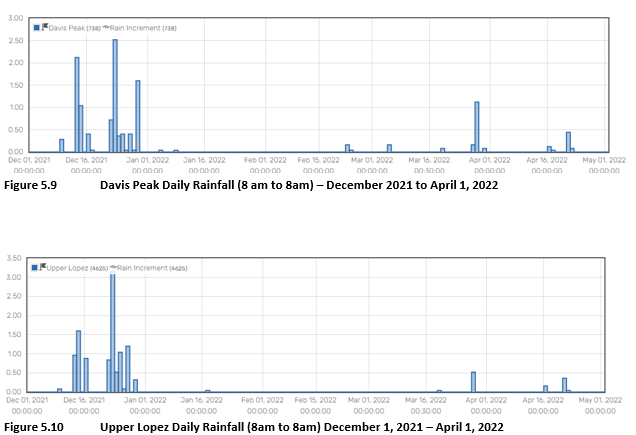
Figures 5.7 through 5.10 provide graphical depictions of rainfall events for the period of December 1, 2020 through March 31, 2021, for three different sites in and near the Lopez Lake target. Note that each graph is scaled according to the range of values observed at that site.
Figure 5.7 Lopez Dam Daily Rainfall (8 am to 8 am) – December 1, 2021 to May 1, 2022
Figure 5.8 SLO Reservoir Daily Rainfall (8 am to 8 am) - December 1, 2021 to April 1, 2022
Figure 5.9 Davis Peak Daily Rainfall (8 am to 8am) – December 2021 to April 1, 2022
Figure 5.10 Upper Lopez Daily Rainfall (8am to 8am) December 1, 2021 – April 1, 2022
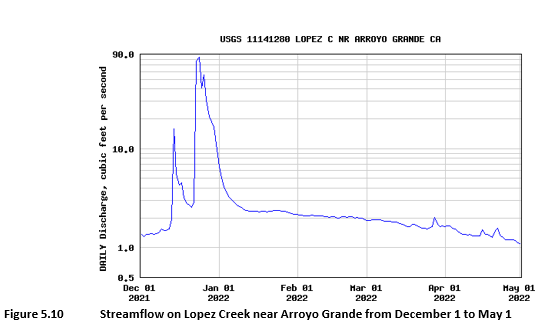
5.2Hydrologic Conditions During the 2021-2022 Winter SeasonIn Figure 5.10, it can be seen that during most of the winter season, little to no runoff occurred on Lopez Creek near Arroyo Grande. The December storm events generated runoff at this gauge, with small spikes from the events on March 28 and April 21.
Figure 5.10 Streamflow on Lopez Creek near Arroyo Grande from December 1 to May 1
5.3Summary of Operations during the 2021-2022 Winter SeasonTable 5-3 summarizes flares used at the various seeding sites during the current season.
Table 5-3 Flare Usage
Due to the uncharacteristically dry January through March period, NAWC extended operations free of charge, in order to seed the storm on April 21st. When budgets allow, a longer seasonal operational period is encouraged, in order to take advantage of such late season productive storms.
5.4Storm Events of the 2020-2021 Winter SeasonThis section describes the storm events that affected the Lake Lopez watershed area during the 2021-2022 operational period. A general discussion of the meteorology accompanying each event is given, followed by a description of the seeding operations (if any). Wind directions, when provided, are always reported in the direction from which the wind is blowing (e.g., a southerly wind means the wind is blowing from the south toward the north). Wind speeds are usually
reported in nautical miles per hour (knots), with 1 knot equal to 1.15 miles per hour. Figures shown in the storm summaries may include the following:
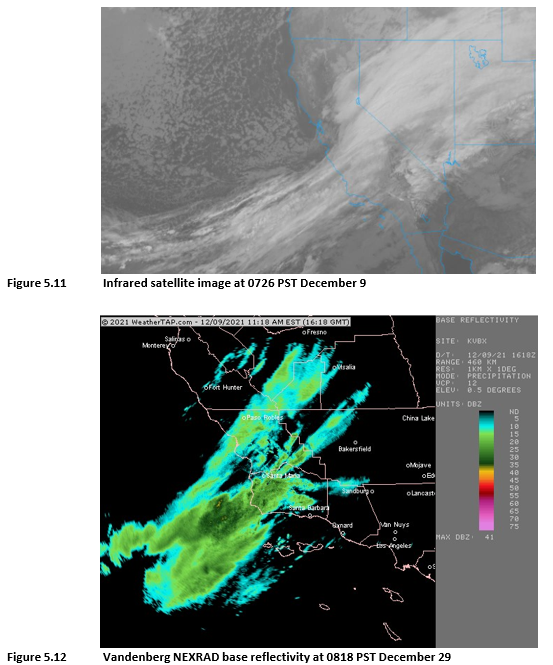
-4°C and -5°C. The closer the height of the -5°C level is to the ground seeding sites, the quicker a seeding effect will begin to be produced in the convection elements embedded in the convective bands. These convective elements transport the seeding material vertically from the ground seeding sites to colder temperatures aloft. December 9, 2021 A frontal precipitation band brought mostly light precipitation, with some modest cloud liquid water values in this band as it moved into San Luis Obispo County beginning around 0800 PST. Winds were from the west to northwest with a significant northerly component at lower to mid levels. For this reason, seeding operations were not possible for the Lopez Lake area in this event. Figures 5.11-12 include a satellite and radar image during this event. Precipitation totals were light, generally a quarter inch or less with this system.
Figure 5.11 Infrared satellite image at 0726 PST December 9
Figure 5.12 Vandenberg NEXRAD base reflectivity at 0818 PST December 29
December 13-14, 2021 A major storm event affect most of California during the December 13-14 period. Early in the event the -5° C level was up near 650 mb (about 12,000 feet) with strong south-southwesterly winds near 50 knots near and just below that elevation. There is also a significant stable layer below this at times, which would prevent any seeding material from reaching the -5° C in these conditions. By the morning of December 14, good coverage of rainfall continued with precipitation totals in many mountainous areas exceeding 2” of rainfall. By early to mid-morning lower level winds had shifted to the northwest with a shallow surface frontal boundary, although
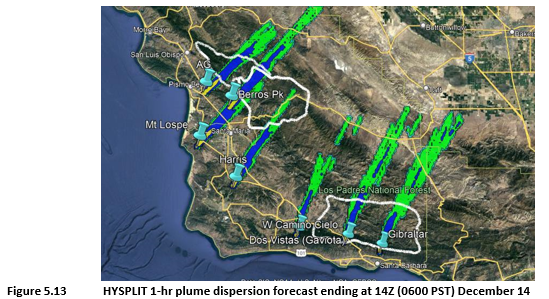
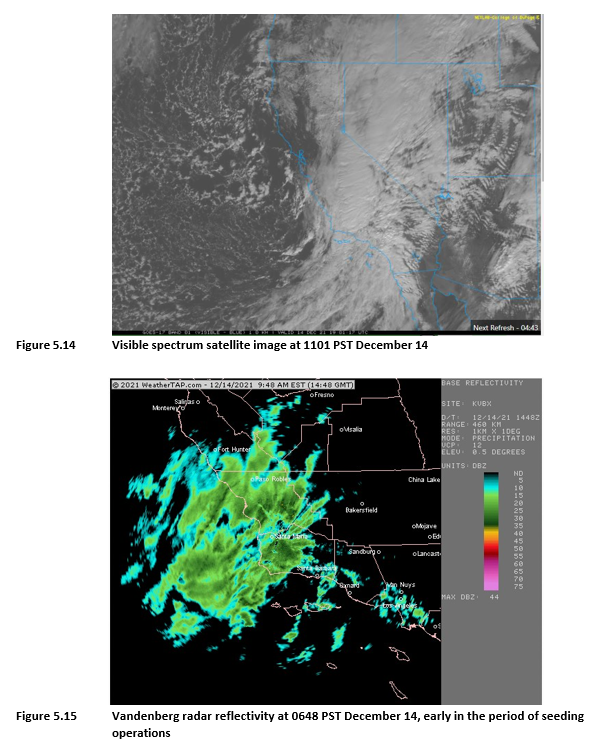
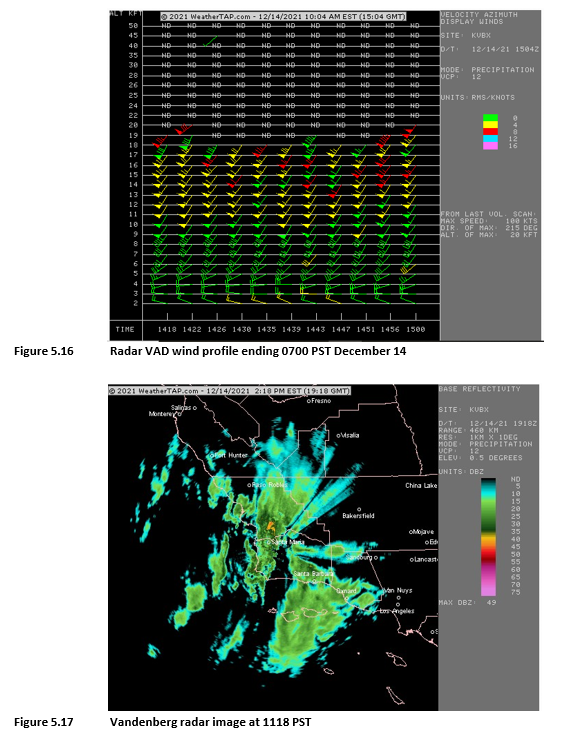
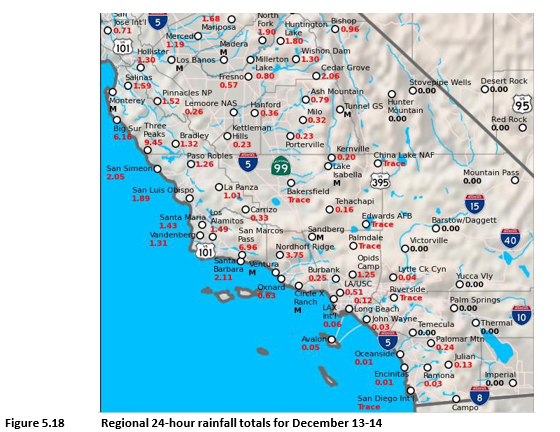
mid-upper level winds remained strong southwesterly until later in the morning. HYSPLIT forecasts of seeding plumes (Figure 5.13), as well as surface observations showed a lower level shift to the northwest already at 13Z (0500 PST). The main frontal band and 700 mb level cold front arrived around 18Z (1000 PST). Figure 5.14 is a visible spectrum satellite image of the system on December 14. Seeding began at the Arroyo Grande site a little after 0800, continuing for a couple of hours until winds had shifted to west-northwest. The overall structure of this storm consisted of a broad area of moderate precipitation with subtle embedded bands, although convection did not appear to be particularly strong. Thus, seeding was limited to the latter portion of the event when temperatures cooled aloft, mixing improved and at least some convective activity was present. Hourly precipitation amounts with these bands were generally around a quarter inch in the target areas. Figures 5.15- 16 show a radar reflectivity image and a Velocity Azimuth Display (VAD) time/height wind cross section during this time. Figure 5.17 is another radar image near the end of operations, and Figure 5.18 is a regional map of precipitation totals with this storm.
Figure 5.13 HYSPLIT 1-hr plume dispersion forecast ending at 14Z (0600 PST) December 14
Figure 5.14 Visible spectrum satellite image at 1101 PST December 14
Figure 5.15 Vandenberg radar reflectivity at 0648 PST December 14, early in the period of seeding operations
Figure 5.16 Radar VAD wind profile ending 0700 PST December 14
Figure 5.17 Vandenberg radar image at 1118 PST
Figure 5.18 Regional 24-hour rainfall totals for December 13-14
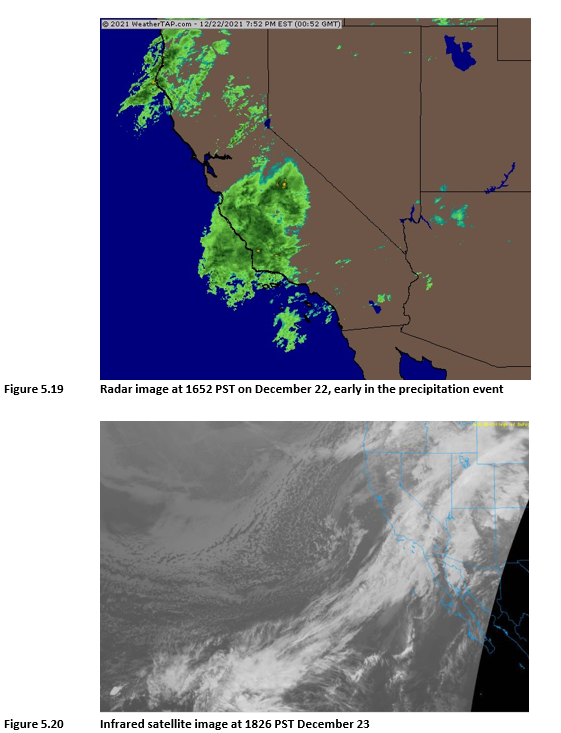
December 22-24, 2021 A large trough in the eastern Pacific developed a deep subtropical moisture tap during this time period, leading to a fairly prolonged period of moderate rainfall along the central coast of California. Most of this event consisted of broad areas of stratiform rainfall with some embedded stable layers and a high -5 C level close to 12,000 feet, so that cloud seeding opportunity was limited to very late in the event. A regional radar image on the evening of December 22 shows the broad area of moderate rainfall covering the central coast (Fig 5.19). Figure 5.20 is a satellite image of this system on the evening of December 23, showing some connection to moisture in the tropics and subtropics and the main trough center well offshore near the latitude of SLO County.
Figure 5.19 Radar image at 1652 PST on December 22, early in the precipitation event
Figure 5.20 Infrared satellite image at 1826 PST December 23
As a broad band of rainfall developed over the area on December 23, rainfall rates increased to near 0.25”/hr in some areas favored by terrain and mostly under 0.2”/hr elsewhere. The 24-hour totals exceeded 2 inches in many mountainous areas. A broad subtropical moisture plume remained over the area with warm temperatures aloft in south-southwest flow.
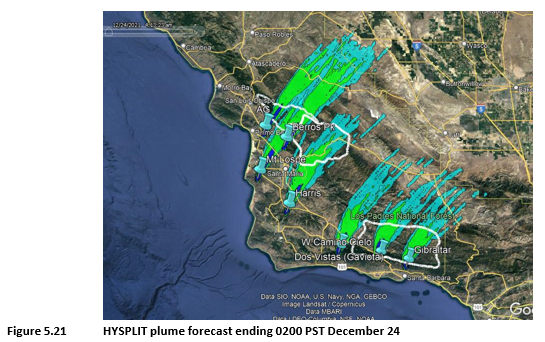
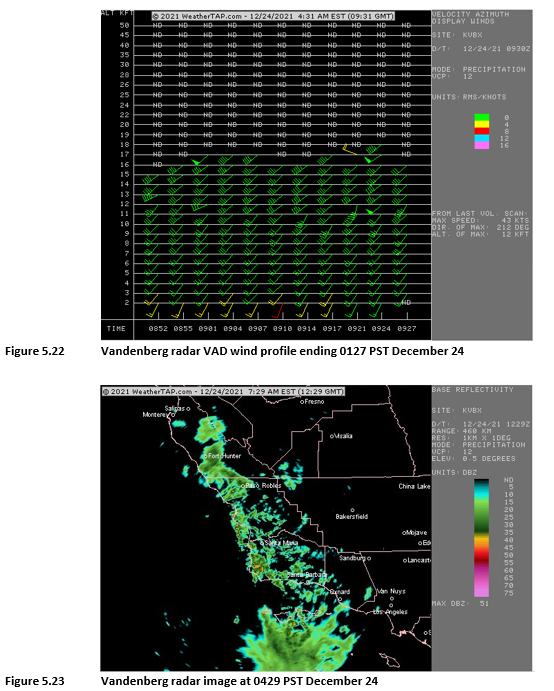
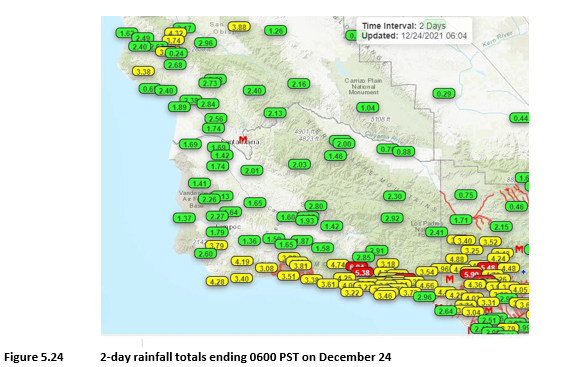
Behind the primary moisture plume, the main core of the trough moved onshore during the night of December 23-24 with convective showers developing. 700 mb temperatures cooled somewhat, to below -4° C with winds from the south-southwest. Between 0400 and 0500 PST, convective showers moved onshore in SLO County with some additional cooling aloft. Two flares were used at Arroyo Grande to target the Lopez Lake area, at 0432 and 0452 PST. Showers were fairly slow moving at this point so that only the Arroyo Grande site was used to target the Lopez Lake area. Figure 5.21 is a HYSPLIT plume forecast for 10Z (0200 PST, a couple of hours prior to operations) along with a radar VAD wind profile during that time in Figure 5.22. Figure 5.23 is a radar image during the main period of seeding operations.
Figure 5.21 HYSPLIT plume forecast ending 0200 PST December 24
Figure 5.22 Vandenberg radar VAD wind profile ending 0127 PST December 24
Figure 5.23 Vandenberg radar image at 0429 PST December 24
By 0600 PST December 24, showers had basically ended with only light/spotty activity remaining. Winds gradually shifted from the southwest to the northwest after this as the trough axis passed the area. Figure 5.24 shows 2-day rainfall totals for this event.
Figure 5.24 2-day rainfall totals ending 0600 PST on December 24
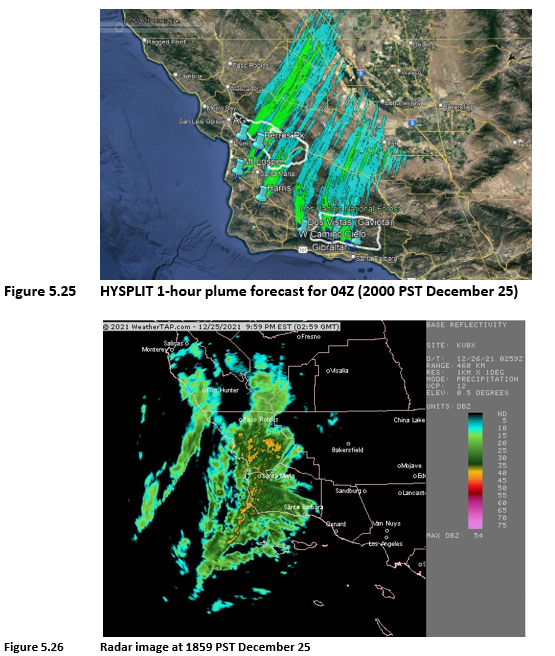
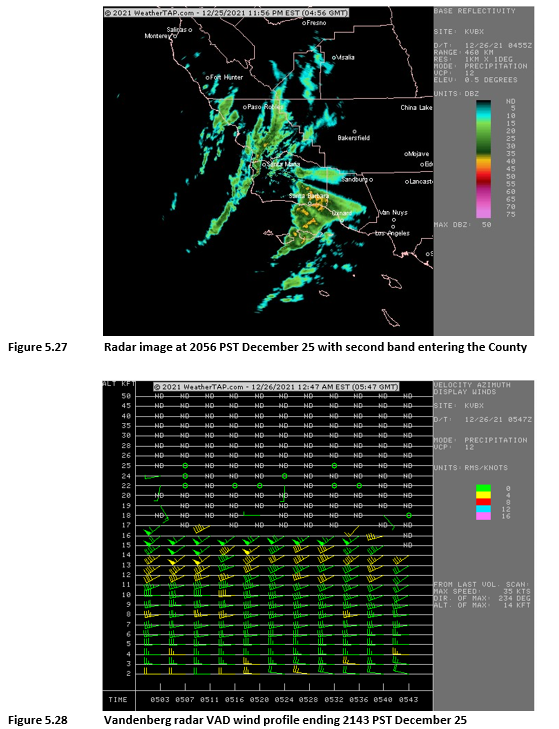
December 25, 2021 A very cold trough was centered near the Washington coast on December 25, with a frontal zone approaching central California in the afternoon. There were multiple convective bands located offshore. Temperatures were colder during this period, near -8° C initially and falling to below - 10° C later in the event. At 1700 PST the first band was progressing onshore into SLO County, with seeding at Arroyo Grande beginning just before 1700 PST in a south-southwesterly wind pattern (Figure 5.25). Winds veered from just east of southerly at the surface to southwest at 700 mb. Precipitation rates were around a quarter inch per hour with this initial band, shown in Figure 5.26. By 2000 PST the main band had moved out of the area, with a small secondary band approaching the coast. An additional flare was used as this secondary band moved onshore, before winds became westerly with its arrival. Figure 5.27 shows this band moving into the area, along with a radar VAD wind profile during this time (Figure 5.28). A third, very thin band approached the coast later in the evening (Figure 5.29) but winds were not suitable for seeding at that point. A total of seven flares were used to seed the Lopez Lake area in this event, and rainfall amounts were around three-quarters of an inch in the vicinity of the target area (Figure 5.30).
Figure 5.25 HYSPLIT 1-hour plume forecast for 04Z (2000 PST December 25)
Figure 5.26 Radar image at 1859 PST December 25
Figure 5.27 Radar image at 2056 PST December 25 with second band entering the County
Figure 5.28 Vandenberg radar VAD wind profile ending 2143 PST December 25
Figure 5.29 Radar image at 2238 PST December 25 with third band moving into the Twitchell area
Figure 5.30 Storm totals map for December 25
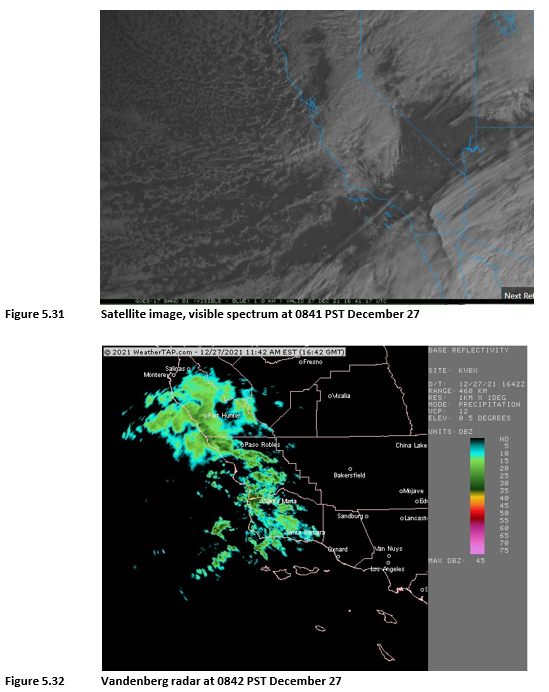
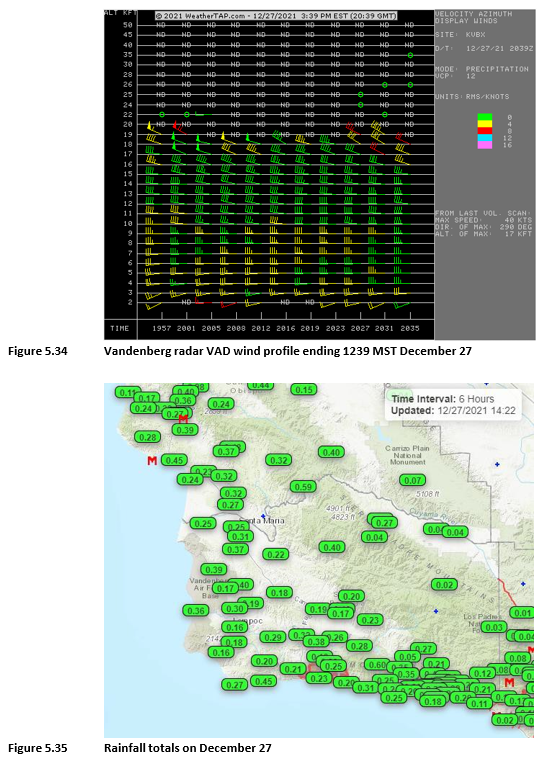
December 27, 2021 A system moving southeastward along the central California coast on December 27 brought some convective showers and bands to SLO County, with a generally westerly wind pattern at 700 mb and more southerly near the surface. The 700 mb temperature was around -8° C. A morning satellite image near the beginning of this event is shown in Figure 5.31.
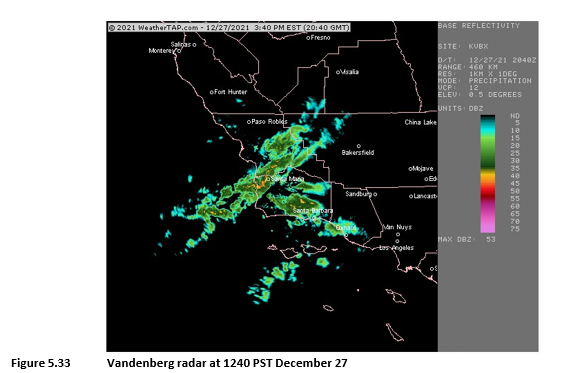
Some fairly localized areas of convective showers were seeded during the morning hours, using seeding flares at 0852 and 0929 PST (Figure 5.32). The main frontal band of showers arrived just before midday with another flare used at 1126 PST. Figure 5.33 is a radar image near that time period, and Figure 5.34 a corresponding radar VAD wind profile. The main band was accompanied by a shift to west-northwesterly winds which became out of range for seeding after the third flare was used. Rainfall rates with the main frontal band were around 0.25”/hour and rainfall totals average around a half inch in the target area (Figure 5.35).
Figure 5.31 Satellite image, visible spectrum at 0841 PST December 27
Figure 5.32 Vandenberg radar at 0842 PST December 27
Figure 5.33 Vandenberg radar at 1240 PST December 27
Figure 5.34 Vandenberg radar VAD wind profile ending 1239 MST December 27
Figure 5.35 Rainfall totals on December 27
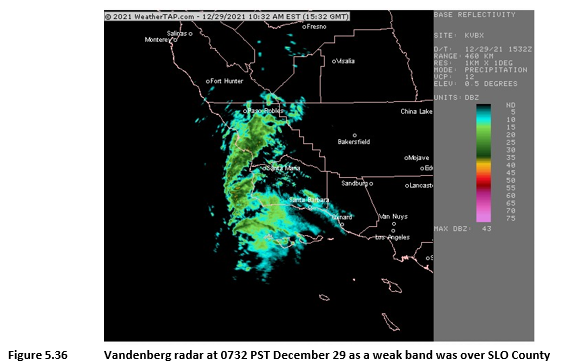
December 29-30, 2021 A trough of low pressure moved southeastward along the California coastline on December 29 and became a weak closed low centered just south of the Central Coast region by December 30. Precipitation with this system was generally light and disorganized, but there was a weak band
on the morning of the 29th that were seeded (Figure 5.36). Two flares were used at Arroyo Grande at 0738 and 0756 PST. Clouds became fairly shallow and broken by later in the day with the main area of rainfall becoming established well to the east/southeast of the area by later on the 29th and through the 30th of December. The 700 mb temperature was around -4° C during most of this event. Rainfall totals were generally around a quarter of an inch.
Figure 5.36 Vandenberg radar at 0732 PST December 29 as a weak band was over SLO County
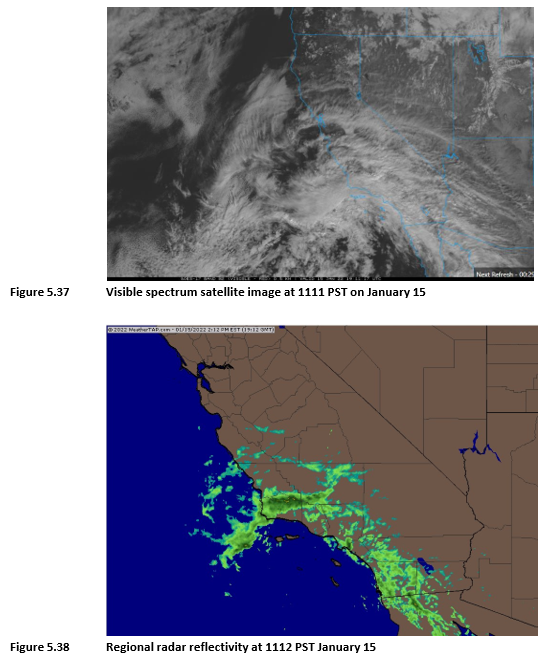
January 15, 2022 A closed low centered well to the southwest of the area brought some subtropical moisture northward into the central coast region. As of 1100 PST, a weak band of mostly elevated showers was crossing the area with winds generally light or SE near the surface and southerly aloft. The antecedent air mass was very dry per 12Z Vandenberg sounding and precipitation was mainly produced by a mid/high cloud deck with echoes as high as about 30k feet, and mostly evaporating in lower and mid levels of the atmosphere. The 700 mb temperature was generally in the -3 to - 5° C range within the precipitation band across this area. Precipitation totals were very minimal, with only localized values of a few hundredths of an inch and no seeding opportunity. Figure 5.37 is a visible spectrum satellite image around the time that the band of precipitation (mostly aloft) crossed the area, and Figure 5.38 a corresponding regional radar image.
Figure 5.37 Visible spectrum satellite image at 1111 PST on January 15
Figure 5.38 Regional radar reflectivity at 1112 PST January 15
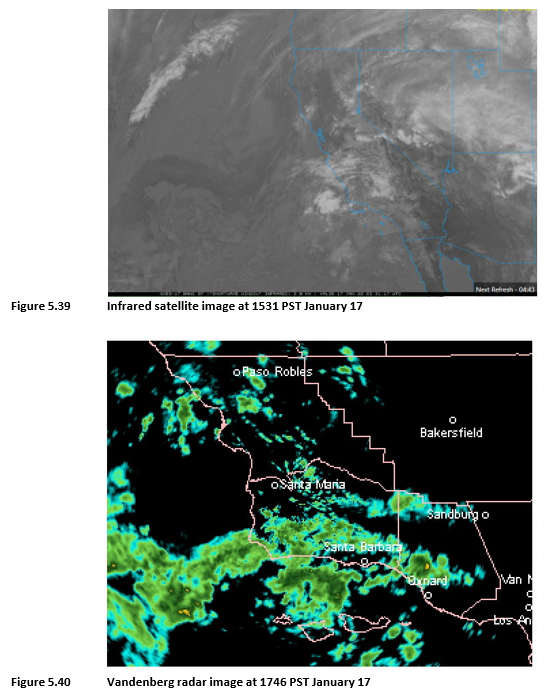
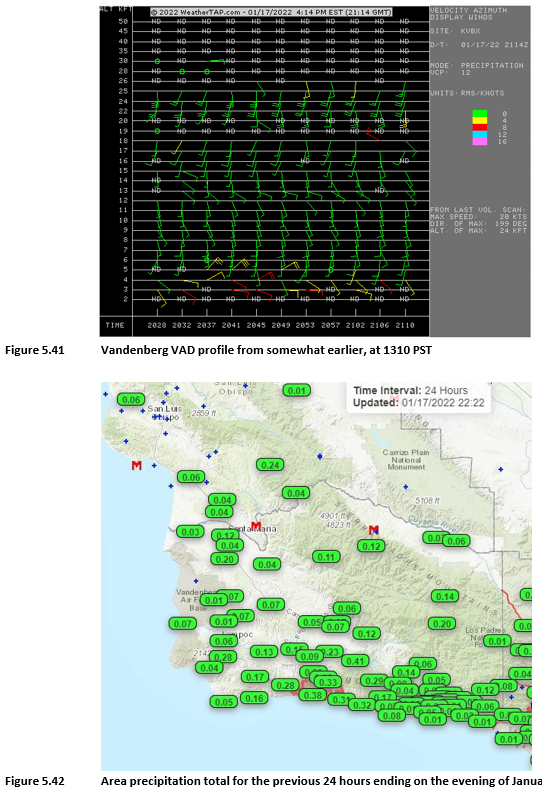
January 17, 2022 The closed low which had brought very minimal shower activity on the 15th remained off the coast until late on January 17, when it moved onshore in the central/southern coastal CA region. The structure of this system was quite similar to before, although the air mass was somewhat more saturated as it finally moved onshore and the 700 mb temperature was around -4 C. Figure 5.39 is an infrared satellite image of this weak system on the afternoon of the 17th. This placed the freezing level near 7,500 feet elevation and the -5 C level close to 11,000 feet. A few bands of light showers affected the area during the late afternoon and evening, with generally very light
precipitation amounts. Figures 5.40-41 show radar reflectivity and a VAD profile respectively during the event. Figure 5.42 shows 24-hour precipitation totals ending on the evening of January 17.
Figure 5.39 Infrared satellite image at 1531 PST January 17
Figure 5.40 Vandenberg radar image at 1746 PST January 17
Figure 5.41 Vandenberg VAD profile from somewhat earlier, at 1310 PST
Figure 5.42 Area precipitation total for the previous 24 hours ending on the evening of January 17
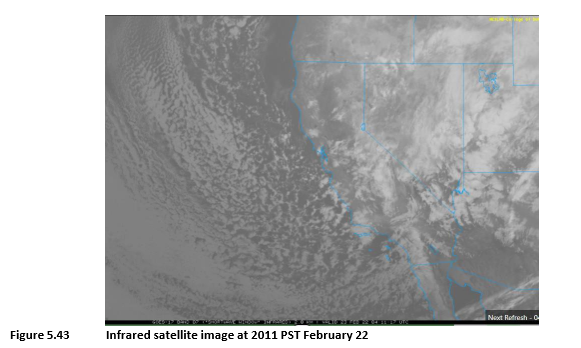
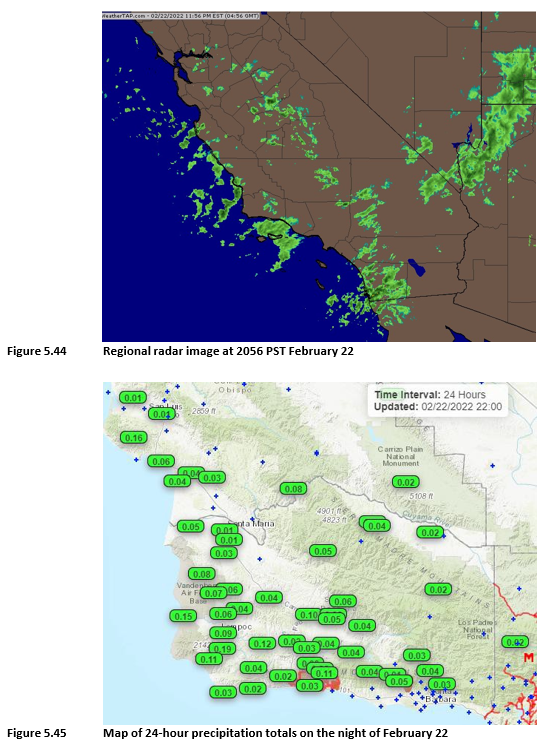
February 22, 2022 A large and very cold trough was centered over California and Nevada on February 22. Only limited moisture existed with this system, and 700 mb temperatures fell to near -15 to -16 C over northern/central California within the core of the trough. Winds were west-northwesterly across the Central Coast region with 700 mb temperatures dropping from about –8 to -15 C with frontal passage in the afternoon and evening. Spotty convective showers were observed during the afternoon and evening hours, with total precipitation amounts generally under 0.1" in the target areas. Precipitation amounts were below a threshold for precipitation to contribute to any runoff, given dry conditions the past 6 weeks or more (and a dry forecast after the event), and winds were generally outside of a favorable range for seeding the target areas. Given these conditions, no seeding operations were conducted. Figure 5.43 is an infrared satellite image at 2011 PST, showing the position of the trough and patchy clouds associated with convective type showers. Figure 5.44 shows a corresponding regional weather radar image during this time, and Figure 5.45 is a map of precipitation totals on February 22.
Figure 5.43 Infrared satellite image at 2011 PST February 22
Figure 5.44 Regional radar image at 2056 PST February 22
Figure 5.45 Map of 24-hour precipitation totals on the night of February 22
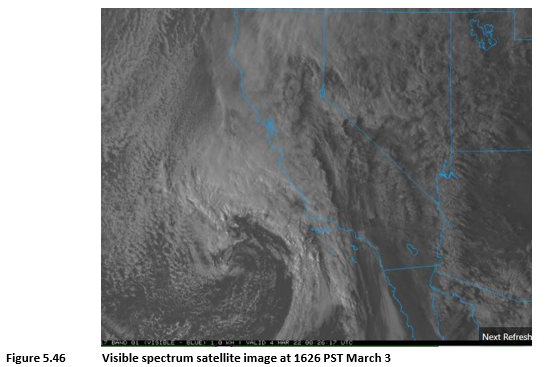
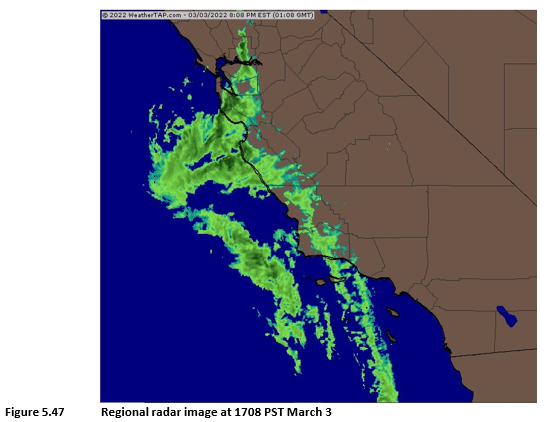
March 3, 2022 A closed low developed offshore on March 3, centered west-southwest of the Central Coast area. Extensive mid and high clouds developed with some high-based weather radar echoes late afternoon, and low-level winds becoming westerly with a shallow onshore flow. By 2200 PST,
bands of light showers existed aloft with high bases and precipitation evaporating above the surface. By early on March 4, the closed low moved onshore in far southern California with some light rain there. Rainfall maps indicated zero totals or only trace amounts for the central coast area with this event. Figures 5.46-47 are satellite and radar images, respectively, from the afternoon/evening of March 3 as this closed low was located well offshore.
Figure 5.46 Visible spectrum satellite image at 1626 PST March 3
Figure 5.47 Regional radar image at 1708 PST March 3
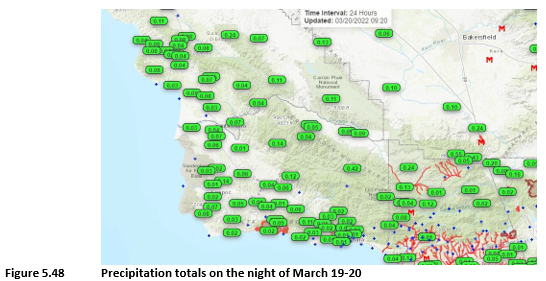
March 20, 2022 A trough moved onshore late on the 19th mostly affecting the Pacific Northwest and northern California. The tail end of a frontal band affected the central coast area after about 1900 PDT Mar 19, with winds abruptly shifting to the northwest with its arrival. The Vandenberg radar was in clear air mode at the time. Precipitation amounts were mostly under 0.10" in the target areas with some higher totals in mountainous areas further inland, favoring the northern slope areas. Based on the light amounts (unfortunately not significant enough to contribute to runoff) and northwesterly wind pattern, no seeding flares were used. Skies cleared by early on March 20. Figure 5.48 shows storm totals during this very brief event.
Figure 5.48 Precipitation totals on the night of March 19-20
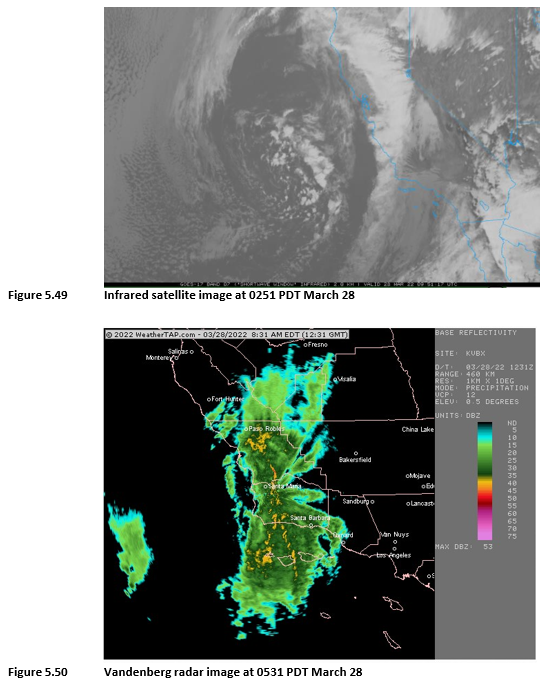
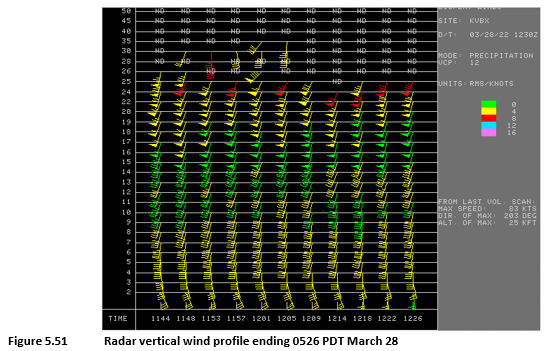
March 28, 2022 A deep and vigorous closed trough was centered off the central California coast early on the morning of March 28, with an initial precipitation band beginning to move onshore by 0200 PDT. This first band brought moderate precipitation and strong southerly winds, around 40-50 knots at 700 mb with the 700 mb temperature falling from about -3 to -5 C in the band. Given the strong winds and relatively warm temperatures, seeding parameters were poor initially. The primary band of rainfall early on the 28th contained only hints of convective elements, and otherwise appeared basically stratiform. This band was quite broad (roughly 70 miles wide) and contained rainfall rates of 0.25”/hour or more at times with southeasterly winds near the surface and strong southerly winds aloft. Based on these wind speeds and a high -5 C level, seeding would not likely be effective in this initial band. Rainfall totals with this first band (generally during a 4-hour period) were approximately 0.50 – 1.00" in most areas. Figure 5.49 is a satellite image of this storm system off the coast early on March 28. Figure 5.50 is a radar image of the initial precipitation band crossing the area, and Figure 5.51 a corresponding vertical wind profile in that band.
Figure 5.49 Infrared satellite image at 0251 PDT March 28
Figure 5.50 Vandenberg radar image at 0531 PDT March 28
Figure 5.51 Radar vertical wind profile ending 0526 PDT March 28
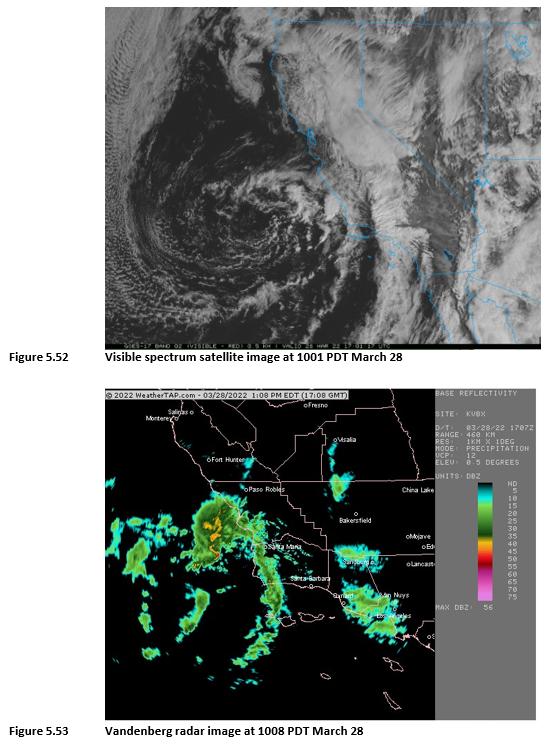
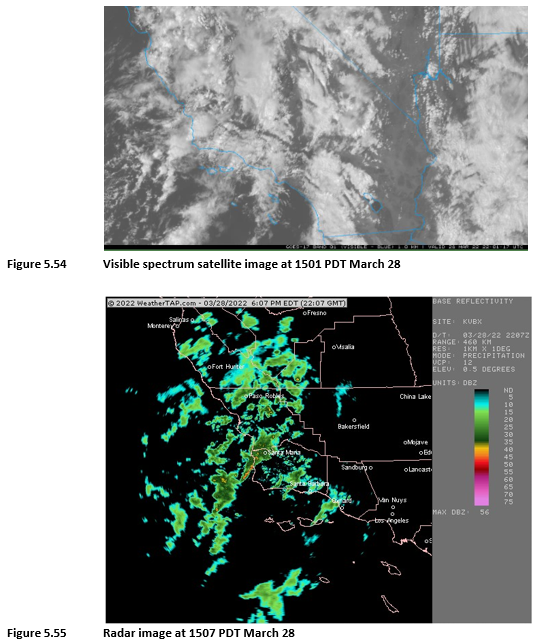
By 1000 PDT, a much weaker precipitation band approached from the southwest with nearly due southerly winds at lower several thousand feet of the atmosphere, as the core region of the trough approached the coast. The 700 mb temperature dropped to about -7 C in this area of the trough per model data, with winds south-southwest at that level. Winds were quite southerly initially, such that the Mt. Lospe and Berros Peak sites were most favorable for the Lake Lopez target area. There was too strong of a southerly wind component to utilize the Arroyo Grande site during this time. Figure 5.52 is a satellite image near the time this second band arrived, and Figure 5.53 a corresponding radar image near that time.
Figure 5.52 Visible spectrum satellite image at 1001 PDT March 28
Figure 5.53 Vandenberg radar image at 1008 PDT March 28
By 1230, scattered small convective showers develop in northwest SB and southwest SLO counties, moving north. Clouds looked good on camera feed from the seeding sites, with fairly low bases. At 1300 PDT, a developing northeast-southwest oriented band of showers was moving into the western part of SB County. This band remained near to just offshore through the
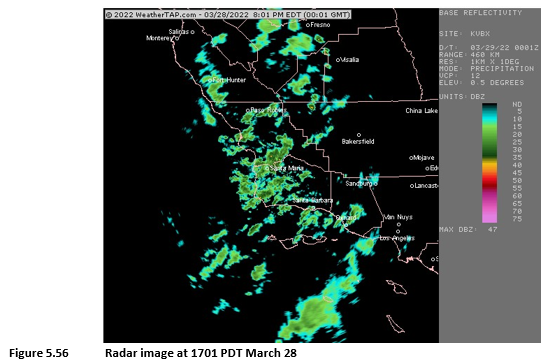
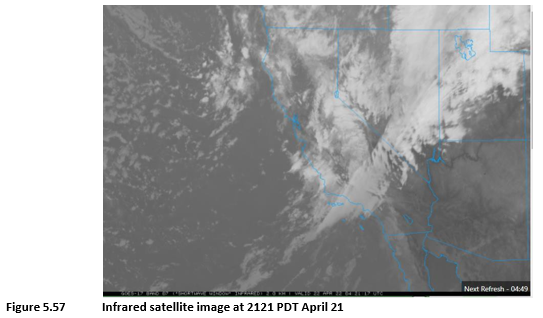
afternoon hours, with a band of fairly strong convective cells just off the west coast of SB County, intersecting southwestern SLO County. Seeding was conducted using the Mt. Lospe and Berros Peak sites during the afternoon, as the precipitation band was essentially stalled in the vicinity of these sites and affected most of the Lake Lopez area as well. The Arroyo Grande site remained to the north of this band and was not in a good position to use. Figure 5.54 is a satellite image during the afternoon as a precipitation band was located near the coast. Figure 5.55 is a corresponding radar image.
Figure 5.54 Visible spectrum satellite image at 1501 PDT March 28
Figure 5.55 Radar image at 1507 PDT March 28
By 1700, showers became much more disorganized (Figure 5.56) with southerly flow near surface and southwest flow aloft, with main upper low center just west of Santa Barbara County and slowly drifting eastward. Seeding ended at this time and winds became essentially light and variable at lower levels. Average rainfall rates in most areas through the afternoon hours remained under 0.10"/hour, although with some locally much heavier rates in the vicinity of the narrow precipitation band. 700 mb temperatures remained near -7 C. Winds shifted to the northwest during the evening hours with showers gradually coming to an end at that point.
Figure 5.56 Radar image at 1701 PDT March 28
A summary of flare times for the Lake Lopez target area during this event is shown below (PDT): Harris Grade 1002 Mt Lospe 1007, 1308, 1350, 1427, 1442, 1457, 1513, 1542
Berros Peak 1015, 1227, 1455, 1510, 1542, 1602, 1637
April 21, 2022 A large trough of low pressure moved onshore in California on April 21, with a frontal precipitation band slowly working its way southward along the coast. The base of the trough extended southward to the Central Coast area by late in the day and brought some precipitation during the evening hours. The seeding program was extended (at no additional cost except for the seeding flares used) to allow seeding during this event.
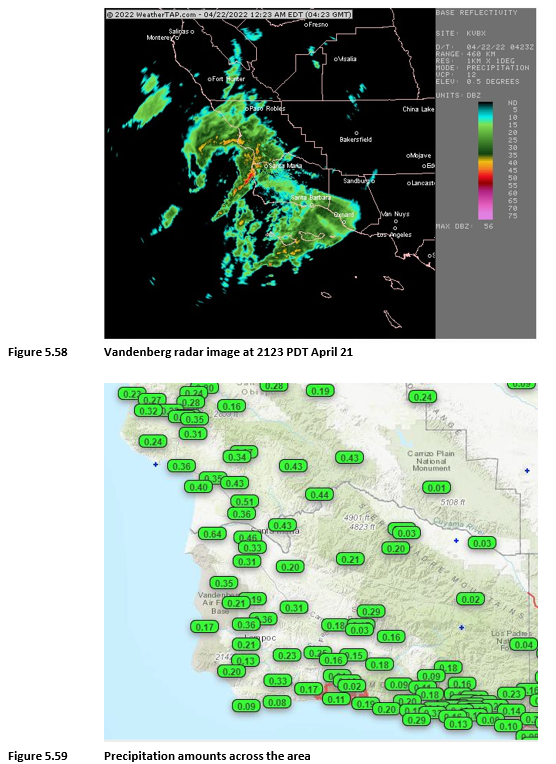
By 2100 PDT, an area of showers with embedded convection began to move onshore in southwestern SLO County. Figures 5.57 and 5.58 show a satellite and radar image, respectively, as this activity began to move onshore. There was an apparent circulation center offshore west of Santa Barbara County as is observed in these images. Winds were from the west-southwest, and seeding began at Arroyo Grande to affect the Lopez Lake target area. HYSPLIT plots were not available for this event (data was not successfully downloaded, perhaps because of a NOAA server upgrade affecting some data products that week). Rainfall amounts with this initial band were mostly 0.25 – 0.40" in roughly an hour, although locally higher. 700 mb temperatures averaged near -6 C in the area of the frontal precipitation band per model data, with slightly colder temperatures behind it. Around 2240 another area of light showers moved onshore in SLO County. These were weak and disorganized, but another flare was used at the AG site with some shower development currently in that area. Precipitation totals overall were around a half inch in and around the target area. Figure 5.59 shows rainfall totals across the area. Winds turned west to northwest with only isolated showers overnight, with seeding ending before 2300 PDT. A total of 4 flares were used to target the Lopez Lake watershed in this event.
Figure 5.57 Infrared satellite image at 2121 PDT April 21
Figure 5.58 Vandenberg radar image at 2123 PDT April 21
Figure 5.59 Precipitation amounts across the area
6.COMPUTER MODELING AND OTHER METEOROLOGICAL DATA
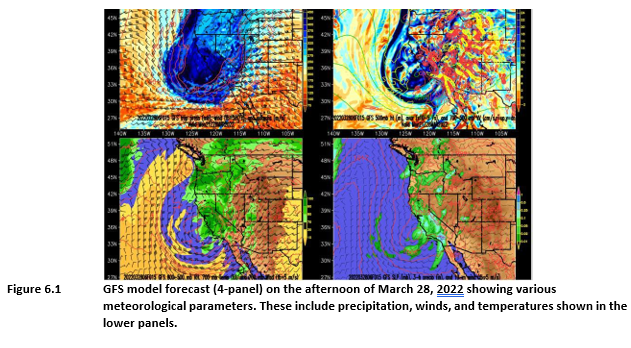
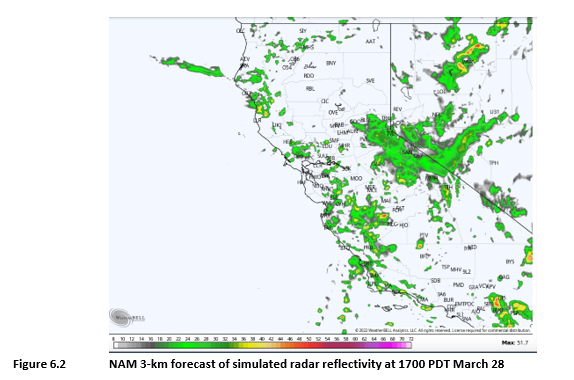
NAWC uses a number of forecasting models as well as a specialized particle dispersion model. The forecasting models including global models like the GFS as well as regional models including the NAM and the WRF. These models help NAWC track the development of storms and predict when storms with appropriate seeding conditions will impact the target area. As the storm approaches these models are viewed in conjunction with satellite and radar imagery. The most productive portions of a convective storm can be relatively short lived, it is therefore essential that flares are burned at the correct time. Dispersion models are used in a number of industries to predict the transmission of particulates in a given medium. The Hybrid Single-Particle Lagrangian Integrate Trajectory (HYSPLIT) model, was designed to predict the flow of airborne particulates based on current weather patterns. This model uses real-time and predictive meteorological data, and calculates the most probable path of particles dispersed from a specific location. NAWC has been granted access to this tool by the National Oceanic and Atmospheric Administration (NOAA) to assist with our execution and evaluation of current and future cloud-seeding programs. Figure 6.1 shows a 4-panel GFS forecast during a storm event on March 28, 2022, which gives a good overview of forecast precipitation in a 3-hour period (lower right) as well as moisture, winds, and temperatures at the 700 mb level (lower left). Figure 6.2 is a somewhat higher resolution 3-km NAM forecast of simulated radar reflectively for 1700 PDT on March 28.
Figure 6.1 GFS model forecast (4-panel) on the afternoon of March 28, 2022 showing various meteorological parameters. These include precipitation, winds, and temperatures shown in the lower panels.
Figure 6.2 NAM 3-km forecast of simulated radar reflectivity at 1700 PDT March 28
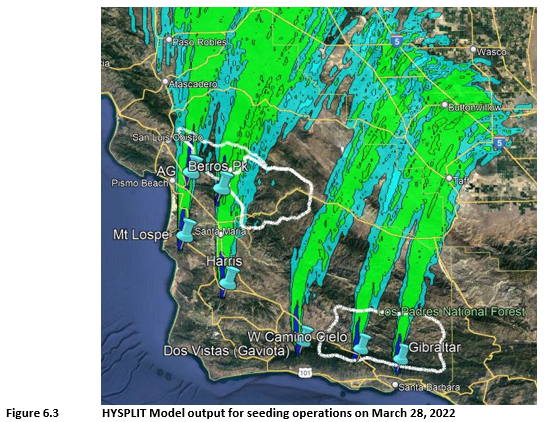
Figure 6.3 shows HYSPLIT model output for this same seeded event on the afternoon of March 28. The colors in Figure 6.3 represent the concentration of the seeding material in the plume, with the highest concentrations shown dark blue followed by green and aqua representing lesser concentrations near the edges of the plume.
Figure 6.3 HYSPLIT Model output for seeding operations on March 28, 2022
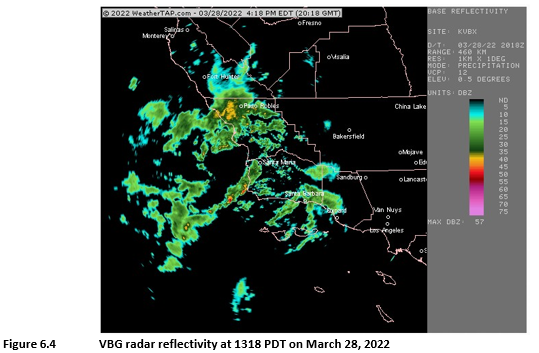
The depiction provided in Figure 6.3 is of the predicted transport of seeding plumes during a seeded storm event. The HYSPLIT plume depictions are of the initial transport and diffusion phase of the plumes. Once the silver iodide has interacted with the super cooled liquid water droplets to instigate the formation of snow flakes, the dispersion will no longer follow the predicted path, as the snowflakes will begin to fall out of the cloud as soon as they are heavy enough. NOTE: HYSPLIT models were ran with all sites for both Santa Barbara and San Luis Obispo collectively as some of the Santa Barbara sites were used to see Lopez Lake when conditions were appropriate). It is important to remember that though a HYSPLIT model run may display dispersion plumes from all sites, during actual operations its likely only some of the more favorable sites were used. For the case displayed above seeding primarily occurred from Harris Grade, with some lesser seeding occurring from Gibraltar. The HYSPLIT model plume forecasts are typically used in making seeding decisions when the wind directions or speeds provided questionable seeding conditions. Seeding plumes that adequately cover portions of the target area are only one consideration, as all other meteorological parameters must also prove favorable for seeding. Another real-time data source that is frequently used in the operation of this program is the Vandenberg Air Force Base (VBG) NEXRAD weather radar. Figure 6.4 provides an example from
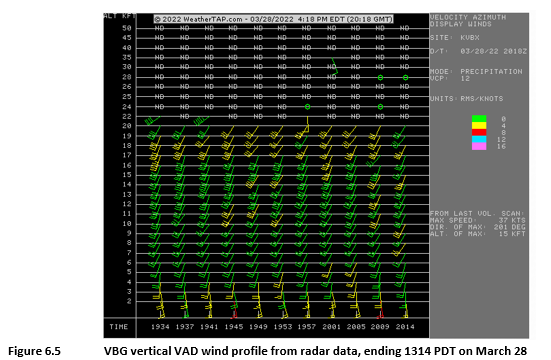
the March 28, event with the corresponding vertical wind profile (VAD) data in Figure 6.5. The plot in Figure 6.5 shows UTC time (x axis, bottom) and elevation above sea level in thousands of feet (y axis, left). The winds between the elevation of a ground-based seeding site and the height of the -5° C level can be quickly assessed visually from the VAD plot, giving the meteorologist a good estimate of the directional (horizontal) transport of seeding material. In addition, the dual-polarized capability of the weather radar can be used to examine plots of precipitation types (such as rain, snow, hail, graupel) in specific cases where this may be useful to the meteorologist.
Figure 6.4 VBG radar reflectivity at 1318 PDT on March 28, 2022
Figure 6.5 VBG vertical VAD wind profile from radar data, ending 1314 PDT on March 28
In addition to these sources, various other weather products such as satellite images, surface data, and upper-air (weather balloon) soundings are often examined by the meteorologist, in support of the seeding program. Additional examples of these are shown in the storm period summaries in the Operations section of the report.
7.REFERENCES
Brown, K.J., R.D. Elliott, J.R. Thompson, P. St. Amand and S.D. Elliott, Jr., 1974: The seeding of convective bands. AMS Preprints 4th Conf. on Weather Modification, Nov. 18-21, 1974, Ft. Lauderdale, FL.
Dennis, A.S., 1980: Weather Modification by Cloud Seeding. International Geophysics Series, 24, Academic Press, New York, New York.
DeMott, D.J., A.B. Sawyer, G. Langer, D.C. Rodgers and J.T. McPartland, 1995: Comparative Characterizations of the Ice Nucleus Ability of AgI Aerosols by Three Methods. WMA, Journal of Weather Modification, Vol. 27, pp. 1-16.
DeMott,P.J., 1999: Report to Ice Crystal Engineering on Tests of Ice Nucleating Ability of Aerosols Produced by New Formulation Pyrotechnics-July 1999. Publication of Department of Atmospheric Sciences, Colorado State University, Ft. Collins, Colorado.
Elliott, R. D., 1962: Note on Cloud Seeding Evaluation with Hourly Precipitation Data. AMS Journal of Applied Meteorology, Vol. 1, pp. 578-580.
Elliott, R. D. and E. L. Hovind, 1964: On Convection Bands Within Pacific Coast Storms and Their Relation to Storm Structure. AMS Journal of Applied Meteorology, Vol. 3, pp. 143- 154.
Elliott, R. D. and E. L. Hovind, 1964: The Water Balance of Orographic Clouds. AMS Journal of Applied Meteorology, Vol. 3, pp. 235 - 239.
Finnegan, W. G., 1999: Generation of Ice Nucleus Aerosols by Solution and Pyrotechnic Combustion. WMA, Journal of Weather Modification, Vol. 31, pp. 102- 108.
Griffith, D.A., M.E. Solak, R.B. Almy and D. Gibbs, 2005: The Santa Barbara Cloud Seeding Project in Coastal Southern California, Summary of Results and Their Implications. WMA, Journal of Weather Modification, Vol. 37, pp. 21-27.
Griffith, D.A. and D.P. Yorty, 2014: Target/Control Analyses for Santa Barbara County’s Winter Cloud Seeding Program. NAWC Report No. WM 14-1 submitted to Santa Barbara County Water Agency.
Griffith, D.A., D.P. Yorty and S.D. Beall, 2015: Target/Control Analyses for Santa Barbara County’s Winter Cloud Seeding Program. WMA, Journal of Weather Modification, Vol. 47, pp. 10-25.
Griffith, D.A., D.P. Yorty, S.D. Beall and T.R.Flanagan, 2018: Results from a Winter Cloud Seeding Feasibility/Design Study Conducted for the Lopez Lake and Salinas Reservoir Drainage Basins in Southern San Luis Obispo County, California. WMA, Journal of Weather Modification, Vol. 51, pp. 1-9.
Rauber, R. M., R. D. Elliott, J. O. Rhea, A. W. Huggins, and D. W. Reynolds, 1988: A diagnostic technique for targeting during airborne seeding experiments in wintertime storms over the Sierra Nevada. AMS, Journal of Applied Meteorology, Vol. 27, No. 7, pp. 811-828.
Reynolds, D.W., 1994: Further Analysis of a Snowpack Augmentation Program using Liquid Propane. WMA, Journal of Weather Modification, Vol. 26, pp. 12-18.
Rosenfeld, D. and W.L. Woodley, 1993: Effects of Cloud Seeding in West Texas, Additional Results and New Insights. AMS, Journal of Applied Meteorology, Vol. 32, pp. 1848-1866.
Rosenfeld, D. and W.L. Woodley, 1997: Cloud Microphysical Observations of Advance to the Texas Cold-Cloud Conceptual Seeding Model. WMA, Journal of Weather Modification, Vol. 29, pp. 56-69.
Solak, M. E., J. Girdzus, D. A. Griffith, 1996: Precipitation Augmentation Potential from Convection Band Cloud Seeding in Santa Barbara County. Prepared for Santa Barbara County Flood Control & Water Conservation Dist. and Water Agency NAWC Report WM 96-3, May 1996.
Thompson, J. R., K. J. Brown, and R. D. Elliott, 1975: Santa Barbara Convective Band Seeding Test Program. NAWC final report 6-135 to U. S. Naval Weapons Center.
Thompson, J. R. and D. A. Griffith, 1988: Precipitation Augmentation Potential from Convective Band Cloud Seeding in Santa Barbara County. NAWC report WM 87-7 to Santa Barbara County Water Agency.
Vonnegut, B., 1947: The Nucleation of Ice Formation by Silver Iodide. American Meteorological Society, Journal of Applied Physics, 18, pp. 593-595.
Woodley, W.L., A.G. Barnston, J.A. Flueck, and R. Biondini, 1983: The Florida Area Cumulus Experiment’s Second Phase. Part II: Replicated and ConfirmatoryAnalyses. Journal of Climate and Applied Meteorology, Vol. 22, 1529-1540.
Woodley,W.L., D. Rosenfeld, P. Sudhikoses, W. Sukarnjanaset, S. Ruangsuttinaruparp, and W. Khantiyanan, 1999: The Thailand Cold- Cloud Seeding Experiment; Results of the Statistical Evaluation. Seventh WMO Scientific Conference on Weather Modification, Chiang Mai, Thailand, Feb. 17-22, 1999.
8.APPENDIX A
BACKGROUND ON CLOUD SEEDING IN SANTA BARBARA COUNTY
There is a long history of cloud seeding programs being conducted in Santa Barbara County. Some of these have been research programs, while others have been operational programs. The research programs have been conducted to better understand winter storm systems that impact Santa Barbara County and also to attempt to evaluate the potential impacts of cloud seeding, especially in terms of any additional rainfall that can be attributed to the cloud seeding activities. Some of these research programs employed randomization techniques whereby approximately one-half of the seedable events were deliberately left unseeded in order to provide data for comparison with the seeded events. Operational programs have been conducted with the primary objective being to maximize the amount of rainfall produced through the cloud seeding activities. As a consequence, randomization is typically not employed with operational programs since the goal is to produce the maximum impact, not to demonstrate that cloud seeding “works” or to document the amount of the cloud seeding increases. Programs in the County date back to the early 1950s, the result of the pioneering work done in the field of weather modification in the late 1940s by Drs. Vincent Schaefer and Bernard Vonnegut.
Table 1 provides a summary of the research programs conducted in Santa Barbara County. There were also some early operational programs conducted in the 1950s and a later program in 1978. The 1978 program was conducted due to drought conditions. The design of the current program is based upon the results obtained from the Santa Barbara research program Phase I and II. Table 2 provides a summary of some of the earlier operational programs.
Table 1 Summary of Santa Barbara Research Programs
Table 2 Summary of Earlier Santa Barbara Operational Programs
The Santa Barbara County Water Agency (Agency) completed a number of tasks during 1981 designed to reactivate cloud seeding activities within the County. These tasks included: 1) preparation of a Negative Declaration Statement (#81-ND-87), 2) conducting a public hearing (December 10, 1981), and 3) obtaining a Weather Resource Management permit from the California Department of Water Resources. North American Weather Consultants (NAWC) was awarded an initial contract from the Agency (dated January 11, 1982) to conduct an operational cloud seeding program during the remainder of the 1982 winter season. Periodic contracts were awarded to NAWC by the Agency to continue these operational programs in a nearly continuous fashion through the 1997 Water Year.
Atmospherics, Inc. of Fresno, California was awarded a contract to conduct an operational program during the 1998 Water Year. Weather Modification, Inc., of Fargo, North Dakota, was awarded a contract by the Agency to conduct operational programs for the 1999 through 2001 Water Years. NAWC, under contract with the Agency, resumed its conduct of operations for the County during the winter of 2001-2002. This program utilized a revised project design based upon the highly successful results of earlier research conducted by NAWC (e.g., Santa Barbara II phase I and phase II experiments). The Agency renewed NAWC’s contract to conduct the cloud seeding operations for the 2002-03 winter season. The Agency released an RFP for another three-year program during the early summer of 2003. NAWC was awarded this contract, which resulted in operations being conducted during the 2003-2004, 2004-2005 and 2005-2006 rainy seasons. The revised design, originally implemented during the 2001-2002 rainy season, was utilized in conducting these programs. The Agency released another RFP for a three-winter program during the spring of 2007. NAWC was again selected to perform this work, which would include both ground and airborne seeding. A large fire impacted substantial portions of the upper Santa Ynez watershed during the summer of 2007 (the Zaca fire). As a consequence, the Agency decided that no cloud seeding would be conducted during the 2007-2008 winter season in the Upper Santa
Ynez watershed. The Agency decided to conduct a program designed to only affect the Twitchell watershed. The Agency expanded the program for the 2009-2010 program to include both the Twitchell and Upper Santa Ynez watersheds although restrictions were in place to avoid seeding impacts in some recent burn areas (La Brea, Jesusita, Gap and Tea fires). The Agency released another RFP for a three-winter program during the summer of 2011. NAWC was again selected to perform this work, which would include both ground and airborne seeding. Only ground seeding was conducted during the 2011-2012 and 2012-2013 rainy seasons. The Agency released another RFP for a three-winter program during the summer of 2014. NAWC was again selected to perform this work, which would include both ground and airborne seeding for the 2014-2015 through the 2016-2017 rainy seasons. NAWC has continued to operate this program, utilizing only ground-based sites in many seasons due to budgetary constraints. Table 3 provides a summary of NAWC operations since 1981.
Research has demonstrated that properly conducted cloud seeding programs offer an environmentally safe and cost-effective means of augmenting precipitation from winter storms. NAWC conducted a study for the Santa Barbara County Water Agency (Thompson and Griffith, 1987), which assessed the precipitation augmentation potential from seeding wintertime cloud bands moving over Santa Barbara County. That assessment covered a sixty-one (61) year period (1920-1980). A follow-on study (Solak, et al., 1996) covered the period from 1981 through 1994, applying the same analysis methods. A key conclusion of these studies was that, under average conditions, seasonal precipitation could be optimally enhanced by 18 to 22 percent at Juncal and Gibraltar Dams through seeding of all appropriate precipitation bands from October through April. Seasonal increases of that magnitude could add as much as 4.5 to 5.0 inches of precipitation to the average seasonal total. Realizing the importance and benefit of this additional rainfall, the water purveyors of Santa Barbara County, under the administrative leadership of the County's Water Agency and/or the Flood Control District have sponsored a cloud seeding program in all water years since 1982, with the exception of 1985-1986 and 2007-2008. The 1985-1986 and 2007-2008 programs were canceled due fires which produced large burn scars in the project areas, which, in turn, created concerns about the potential for excessive erosion and mudslides.
Availability of fresh water in adequate supplies is obviously of paramount importance. Local precipitation has been the major source of water for most areas of California. As part of Santa Barbara County's water resource development and management strategies, cloud seeding operations have been routinely utilized to augment natural precipitation, helping to stabilize annual fresh water supplies. Cloud seeding for precipitation enhancement has been shown to be an effective tool, which carries a very attractive long-term benefit/cost ratio. Table 3 Historical Operational Cloud Seeding Periods in Santa Barbara County, Water Year 1982 to Present
9.APPENDIX B
2021-2022 CLOUD SEEDING PROGRAM SUSPENSION CRITERIA
A. General Criteria for the Entire Project Area in San Luis Obispo CountiesWhenever the National Weather Service (NWS) issues a severe storm, precipitation, flood warning or flash flood warning that affects any part of the project area, the project meteorologist shall suspend operations which may affect that part. Operations will be suspended at least for the period that the warning is in effect. The Project Meteorologist or District/Agency personnel shall retain independent authority to suspend cloud seeding operations for any part, or all of the project area in the event that unforeseen conditions develop during storm events which in their best judgment have the potential to cause flooding or other adverse conditions anywhere within the project area.
San Luis Obispo County Flood Control and Water Conservation District
TO: Zone 3 Advisory Committee
FROM: David Spiegel, PE
DATE: July 21, 2022
SUBJECT: Zone 3 Projects Update
Project Updates:
San Luis Obispo County Flood Control and Water Conservation District
< >CO2 Injection System (No Change)Negotiating Bulk CO2 contractPO issued for equipmentBudget ~$256,000Sludge Bed Curtain Wall Rehabilitation (No Change)~$50,000 per initial quoteCompleted Projects
< >Disinfection Alternatives StudyFault Zone Risk Assessment for Dam Left AbutmentLeak at Main Dam outlet works buildingReplacement of Hach TurbidimeterRepairs to Terminal Dam SpillwayLopez Terminal Dam Monument SurveyDomestic Tank RepairsLopez Water Treatment Plant Rack 1 Membrane ReplacementFault Zone Risk Assessment for Dam Left Abutment |
|||||||||||||||||||||||||||||||||||||||||||||||||||||||||||||||||||||||||||||||||||||||||||||||||||||||||||||||||||||||||||||||||||||||||||||||||||||||||||||||||||||||||||||||||||||||||||||||||||||||||||||||||||||||||||||||||||||||||||||||||||||||||||||||||||||||||||||||||||||||||||||||||||||||||||||||||||||||||||||||||||||||||||||||||||||||||||||||||||||||||||||||||||||||||||||||||||||||||||||||||||||||||||||||||||||||||||||||||||||||||||||||||||||||||||||||||||||||||||||||||||||||||||||||||||||||||||||||||||||||||||||||||||||||||||||||||||||||||||||||||||||||||||||||||||||||||||||||||||||||||||||||||||||||||||||||||||||||||||||||||||||||||||||||||||||||||||||||||||||||||||||||||||||||||||||||||||||||||||||||||||||||||||||||||||||||||||||||||||||||||||||||||||||||||||||||||||||||||||||||||||||||||||||||||||||||||||||||||||||||||||||||||||||||||||||||||||||||||||||||||||||||||||||||||||||||||||||||||||||||||||||||||||||||||||||||||||||||||||||||||||||||||||||||||||||||||||||||||||||||
 County of San Luis Obispo
Public Works, Zone 3 - Lopez Water Project
2022-07-21-Zone-3-Agenda-Packet
 ZONE 3 ADVISORY COMMITTEE
 SAN LUIS OBISPO COUNTY FLOOD CONTROL AND WATER CONSERVATION DISTRICT ZONE 3 ADVISORY COMMITTEE
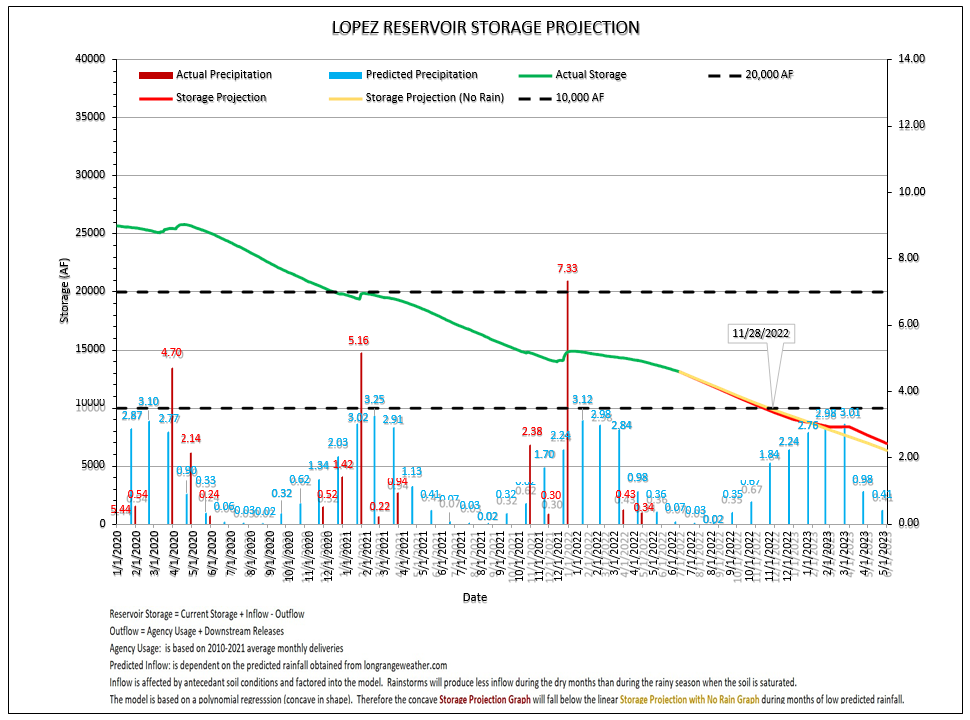
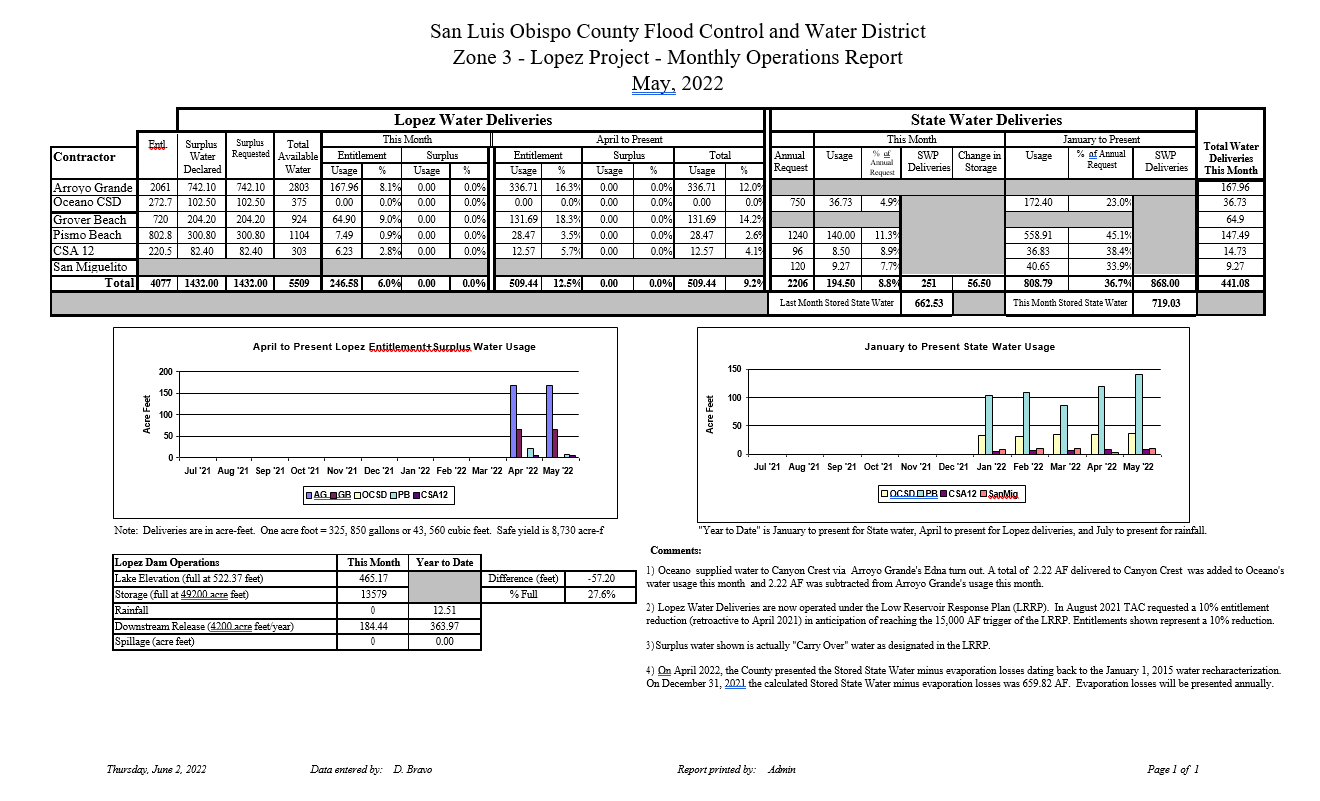
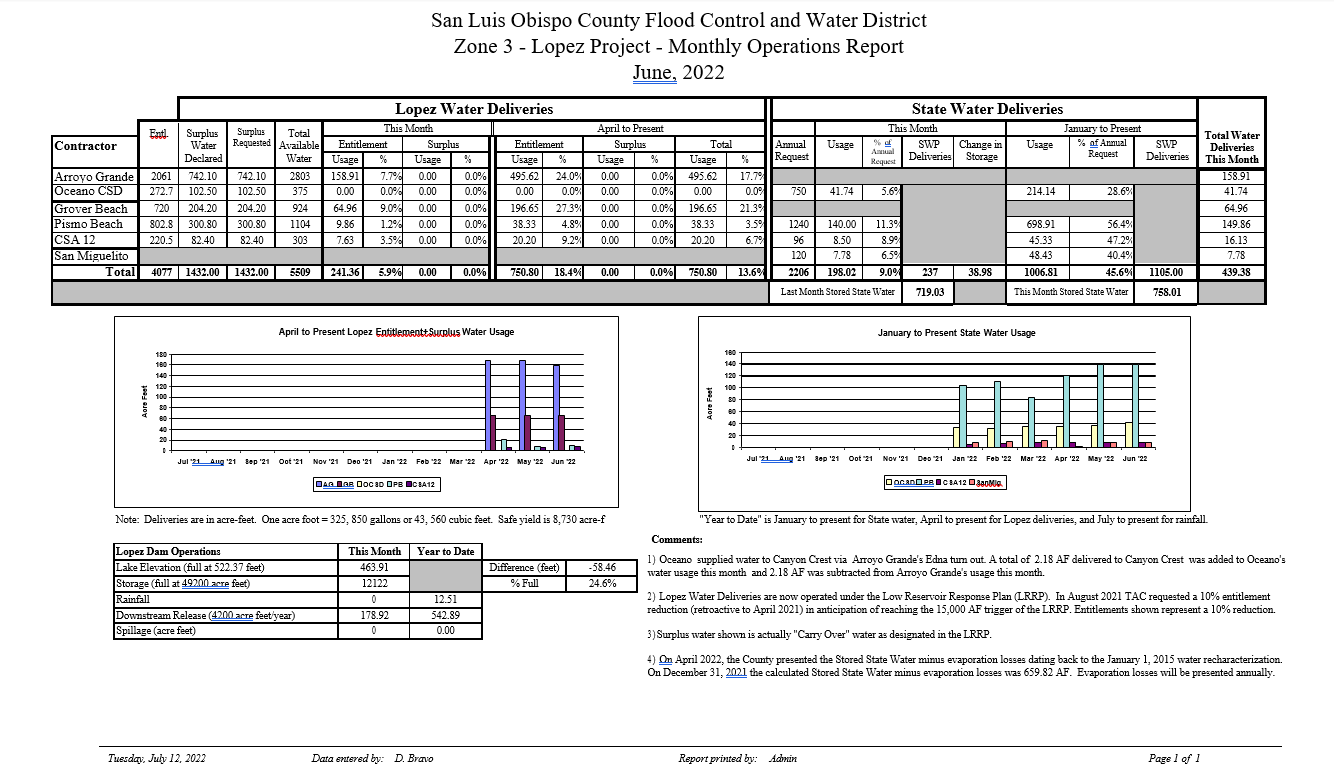
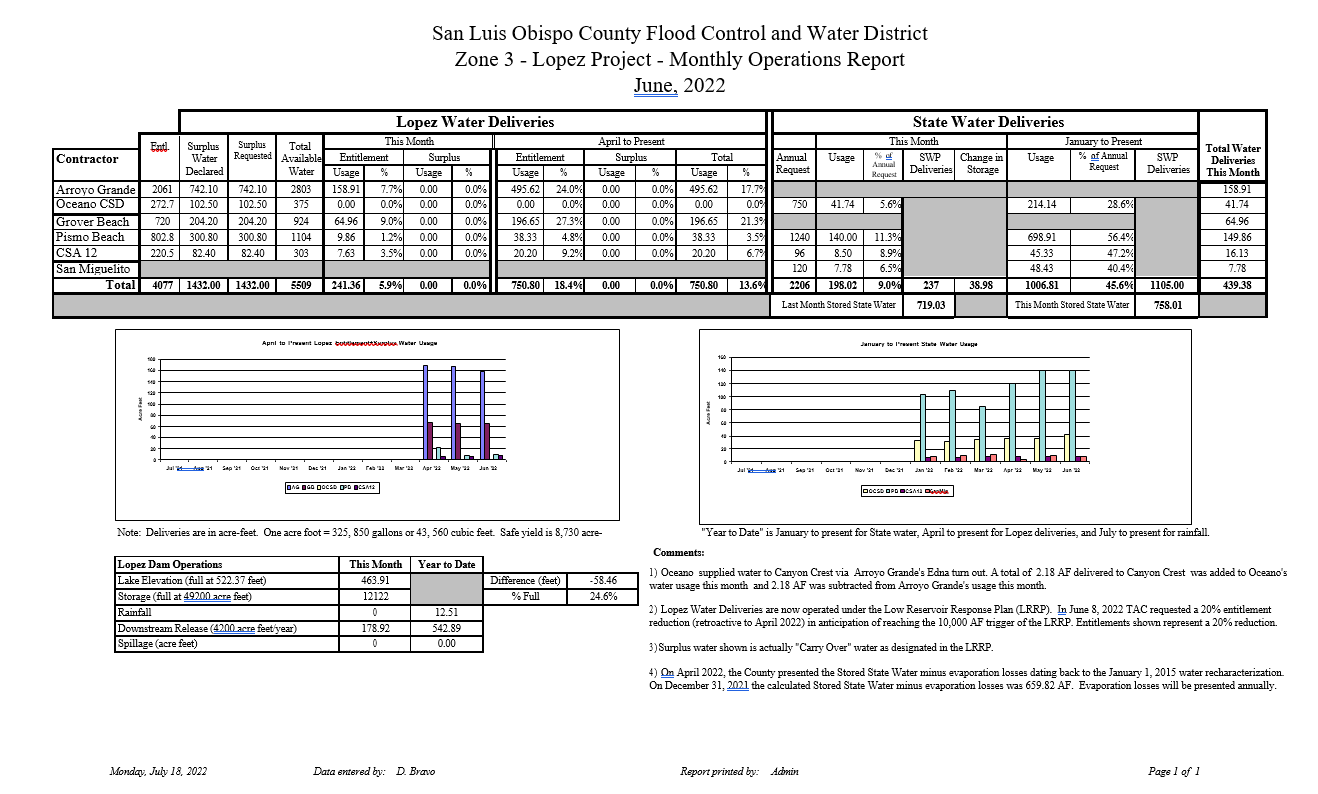


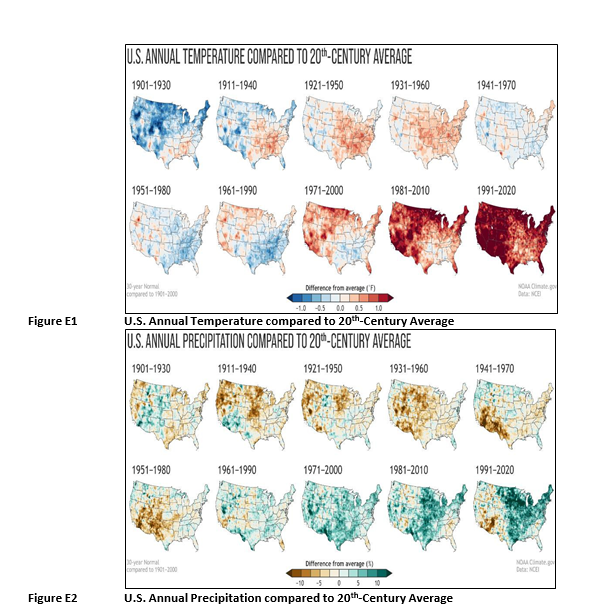
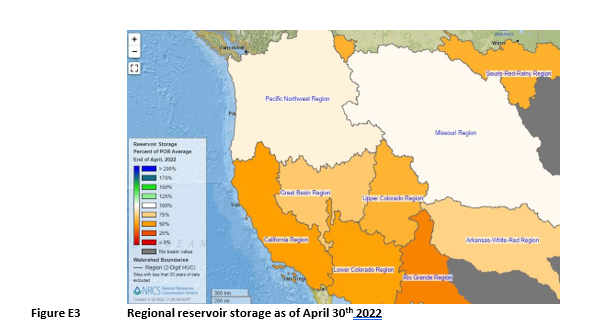
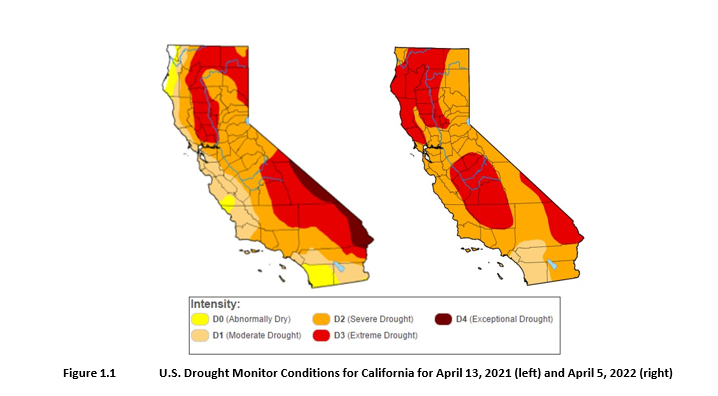
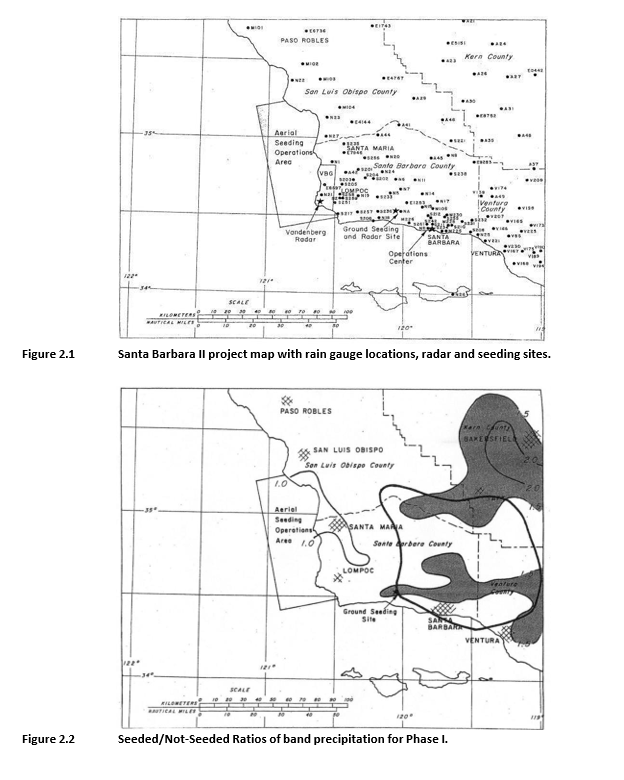


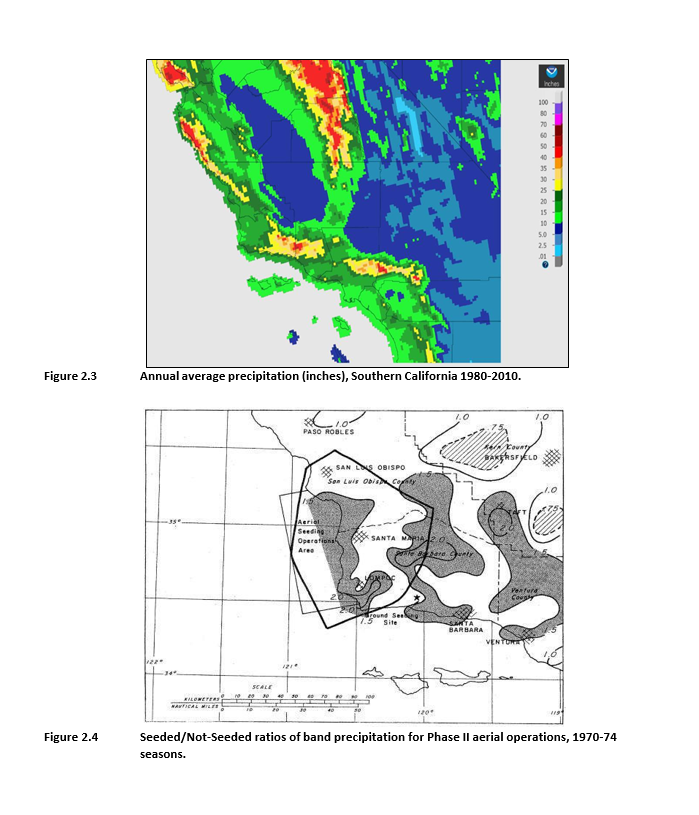


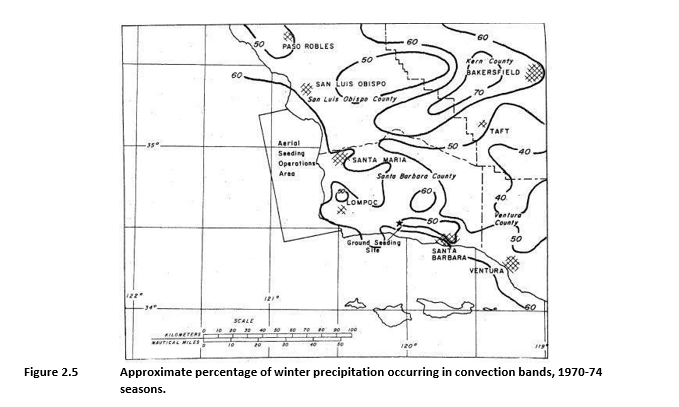

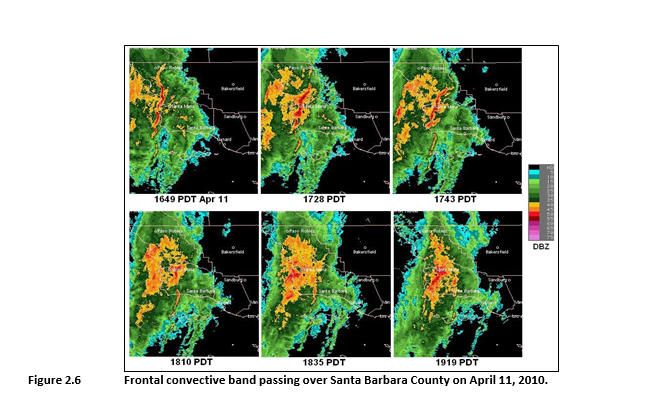 Figure 2.6 Frontal convective band passing over Santa Barbara County on April 11, 2010.